FREE BSS Trading Charting Terminal with our referral account →

Products / BSS Trading Charting Terminal

Trading technology

BSS Trading Charting Terminal

A charting and trading workspace for MetaTrader 5.

Multi-chart layouts, seven chart types, indicators you can code yourself, drawing tools and price alerts in one Windows application.

See it in action

They show the interface and a sample account. They are not a recommendation and not a promise of results.

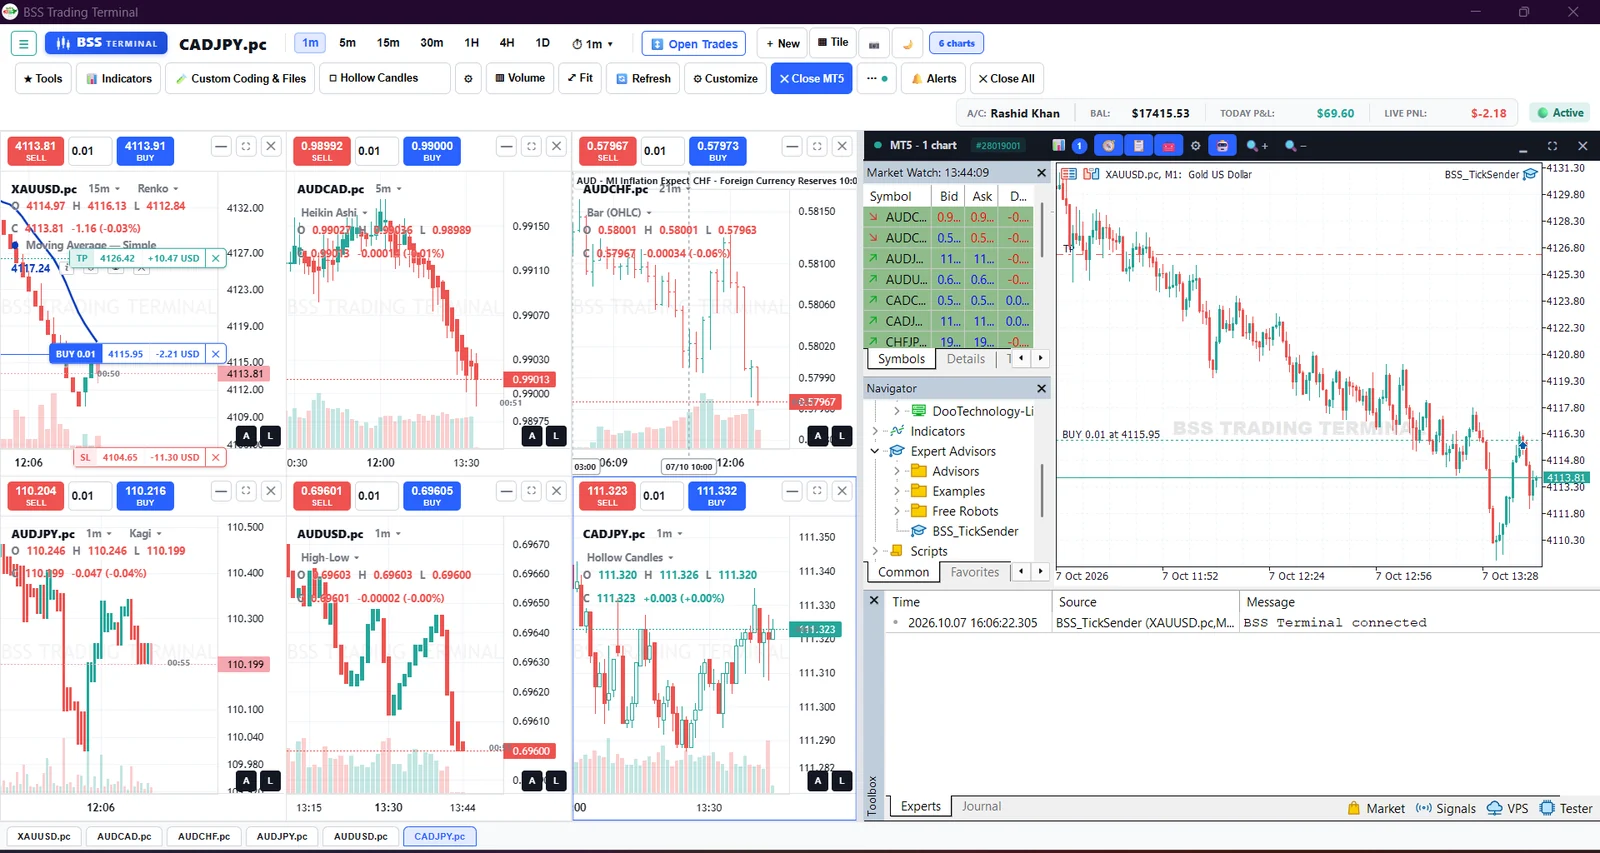
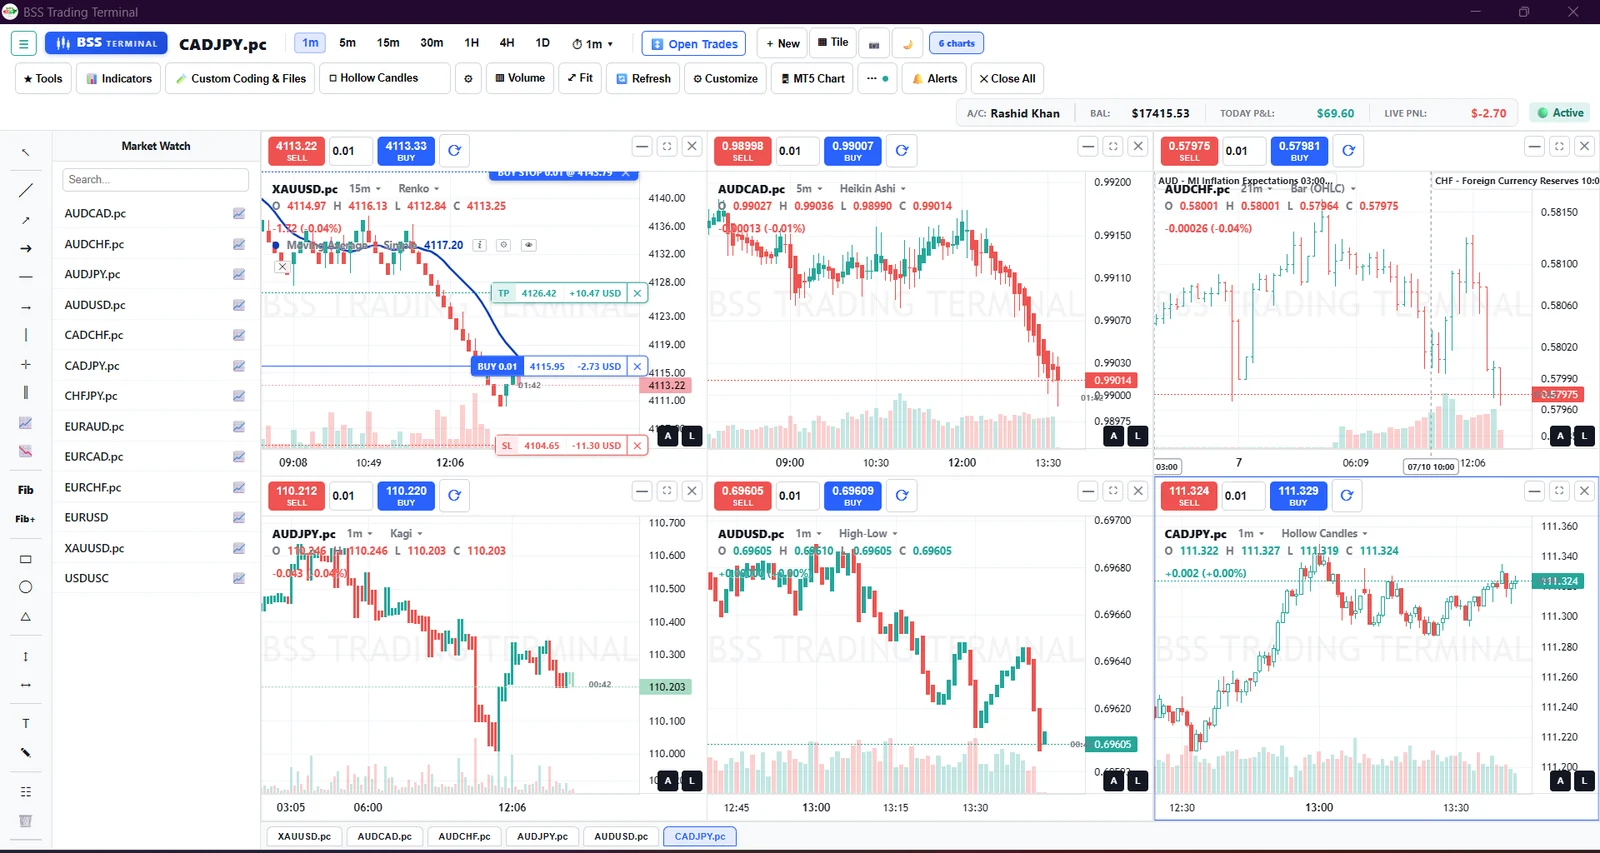
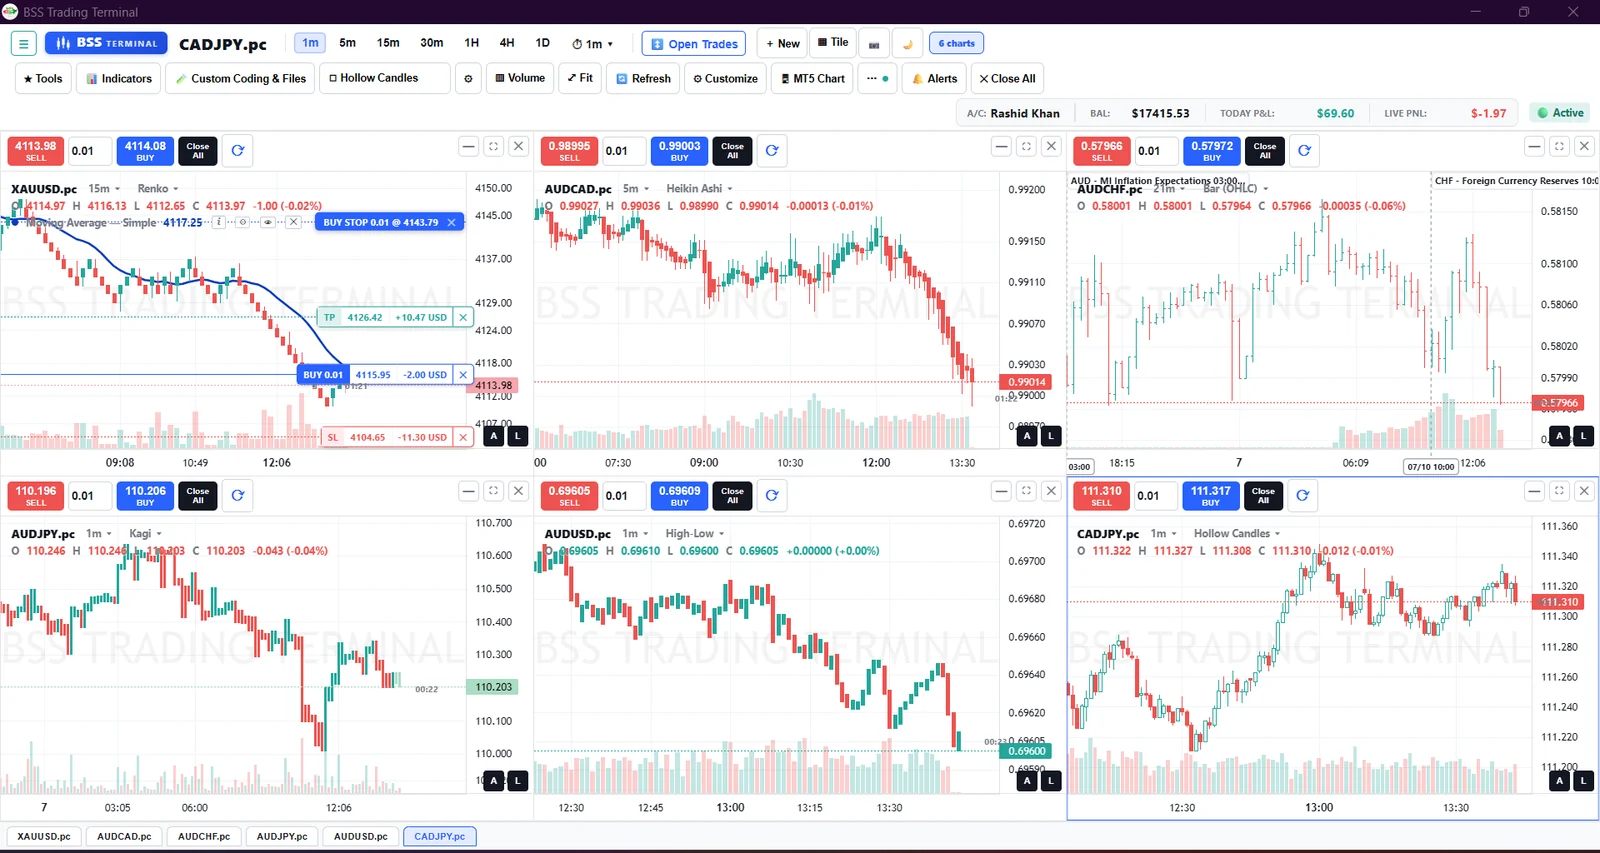
Six charts, each on a different symbol, timeframe and chart type

Six charts, each on a different symbol, timeframe and chart type

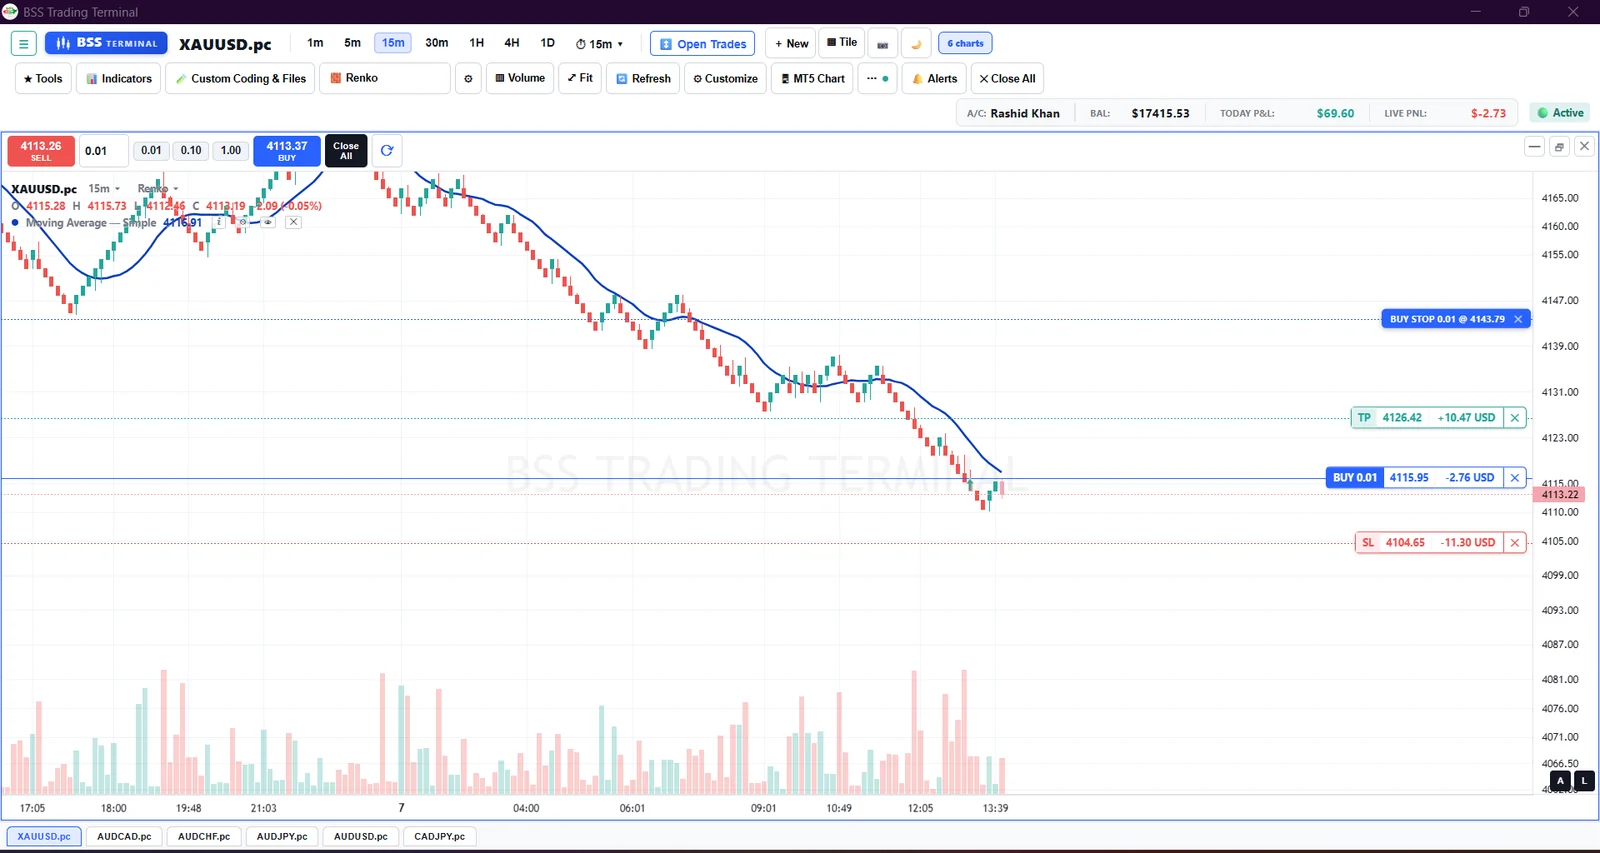
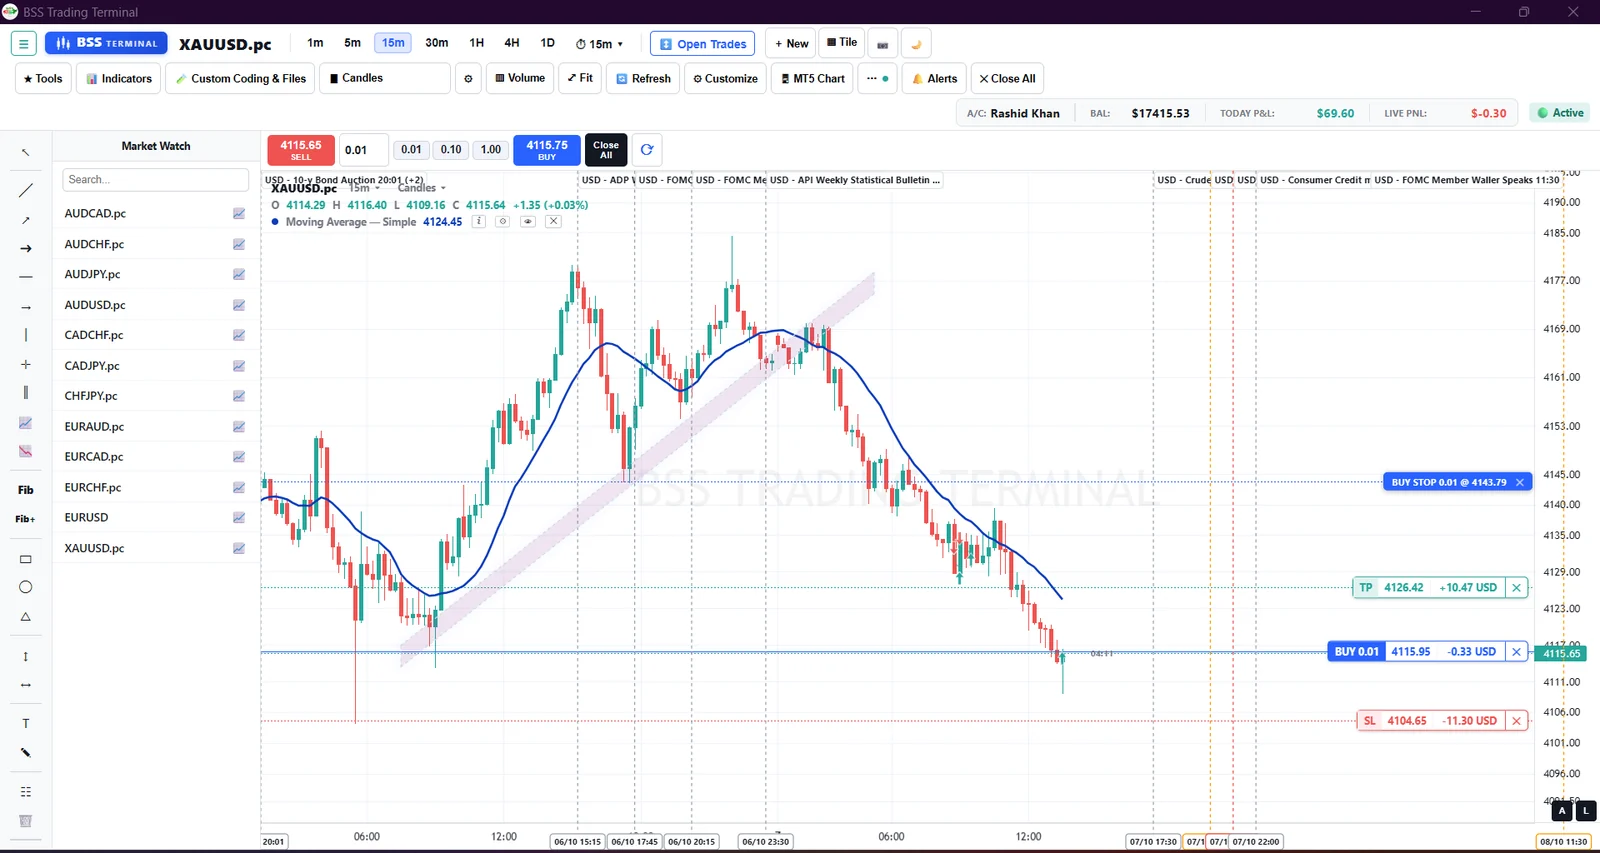
Pending order, entry, take profit and stop loss, each with live profit and loss

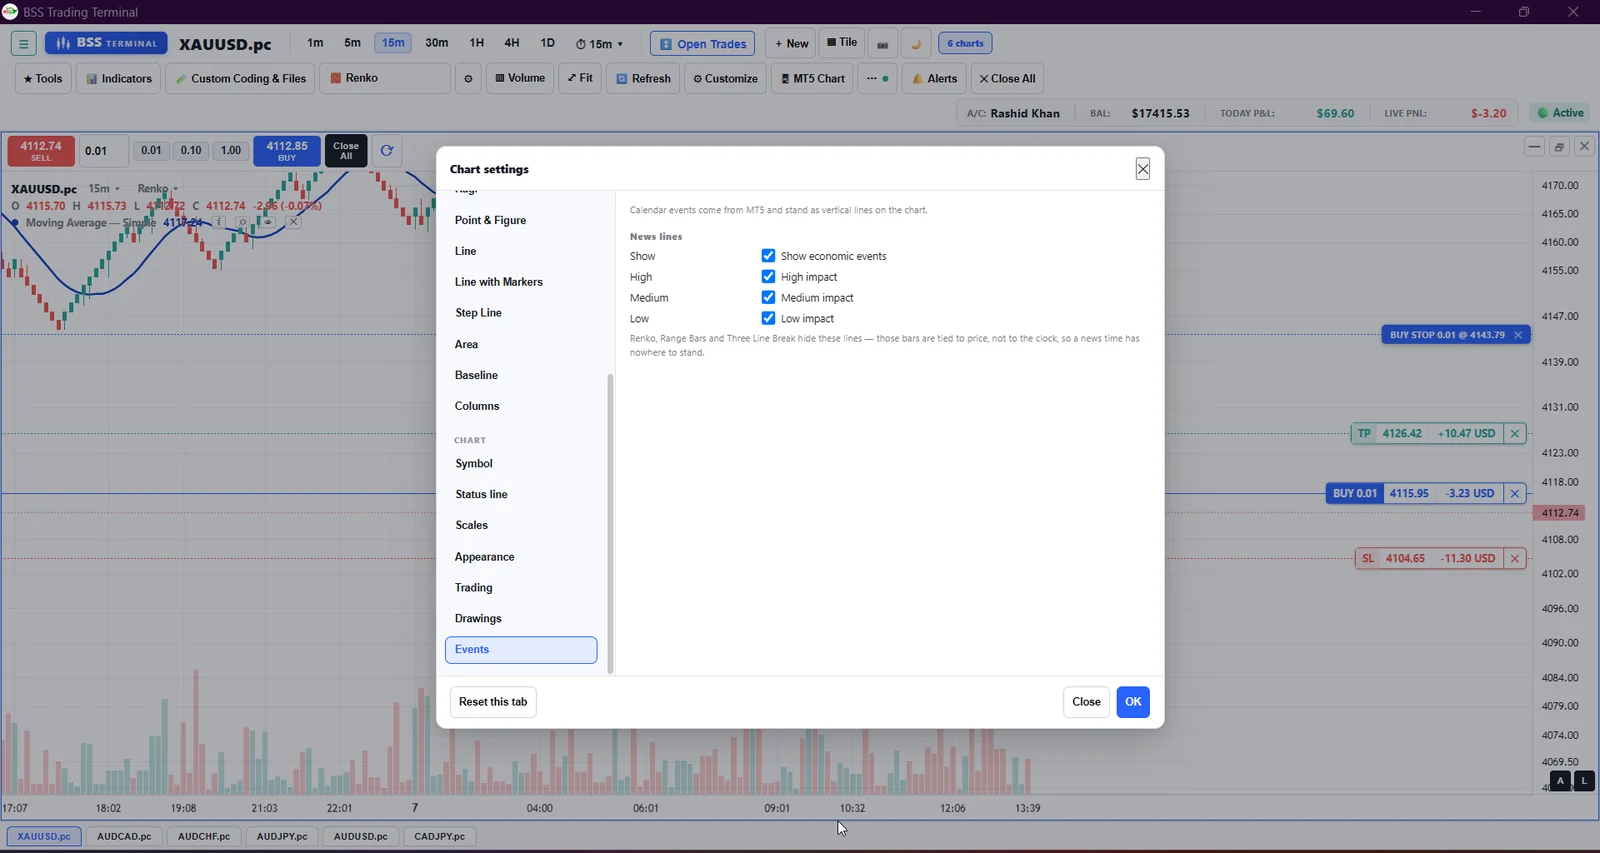
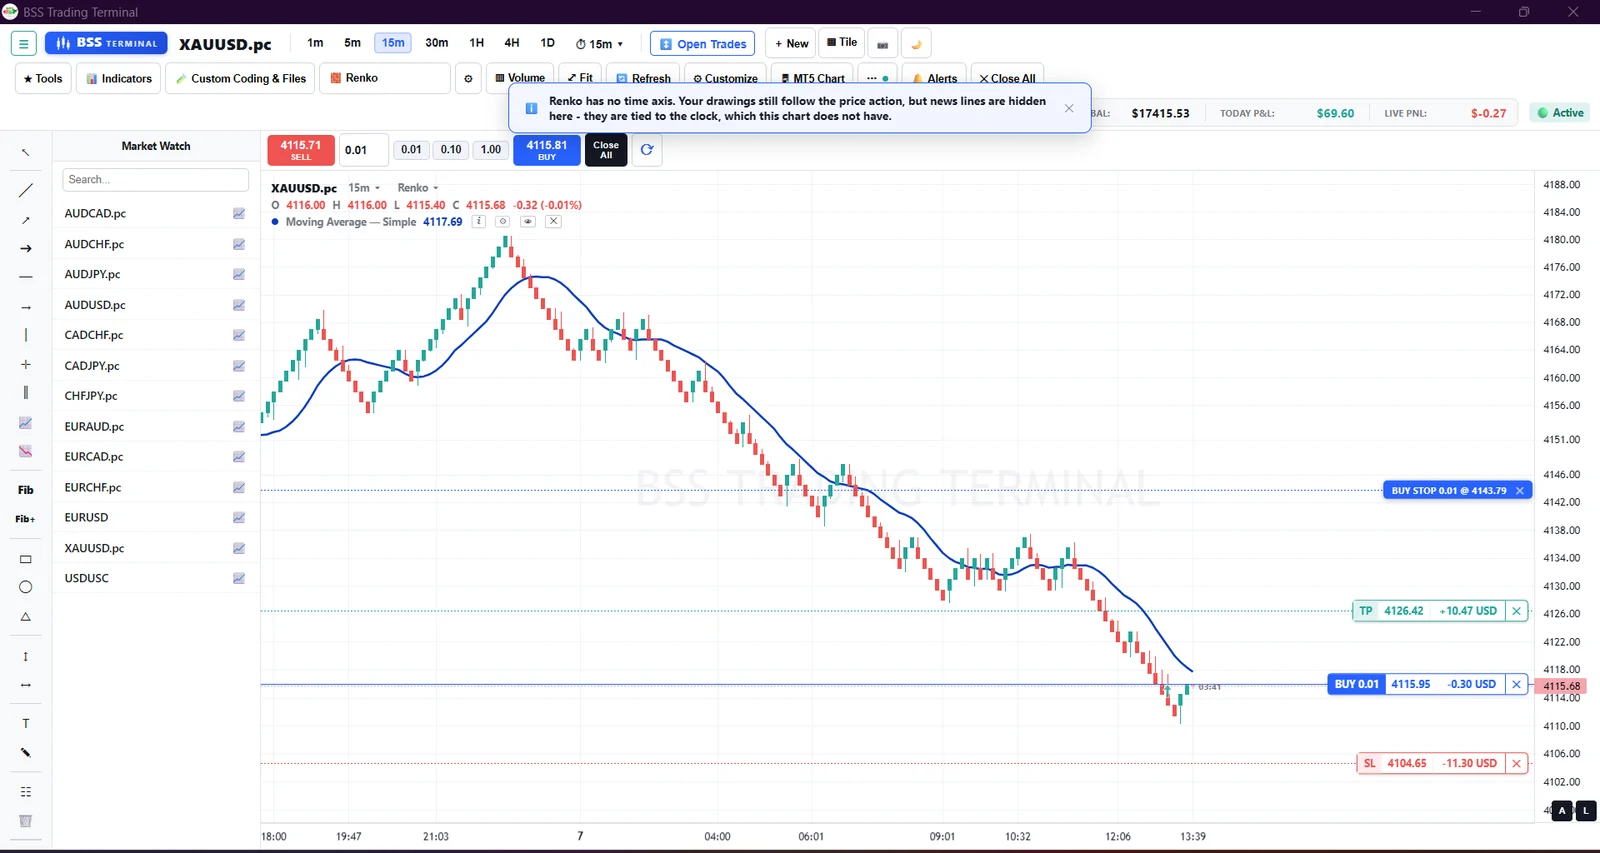
A Renko chart. The terminal explains why news lines are hidden on price-based charts

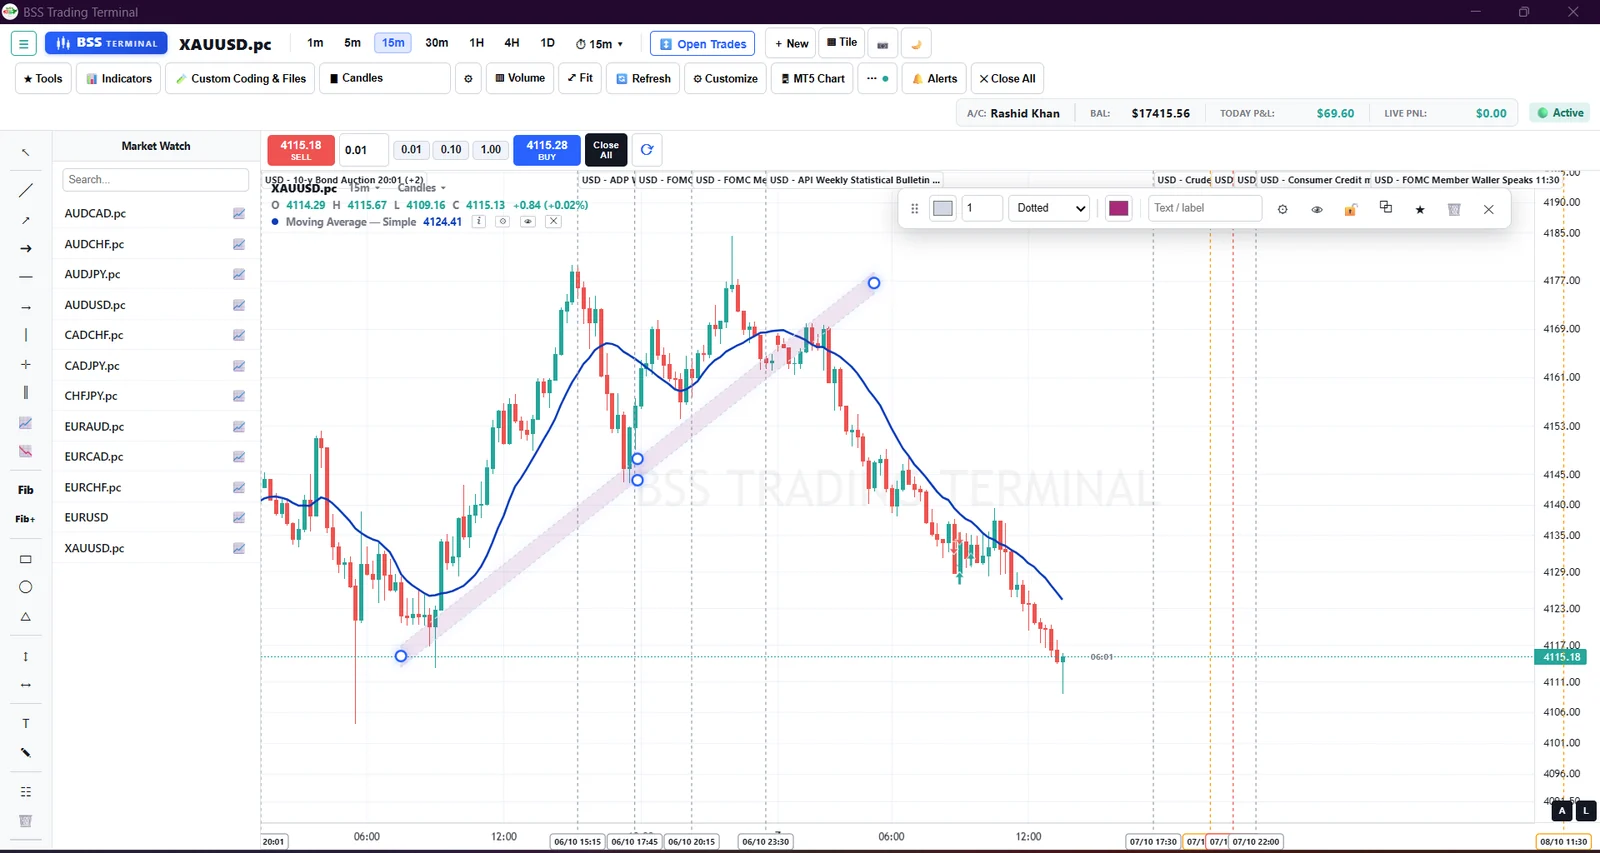
A parallel channel with its floating style bar

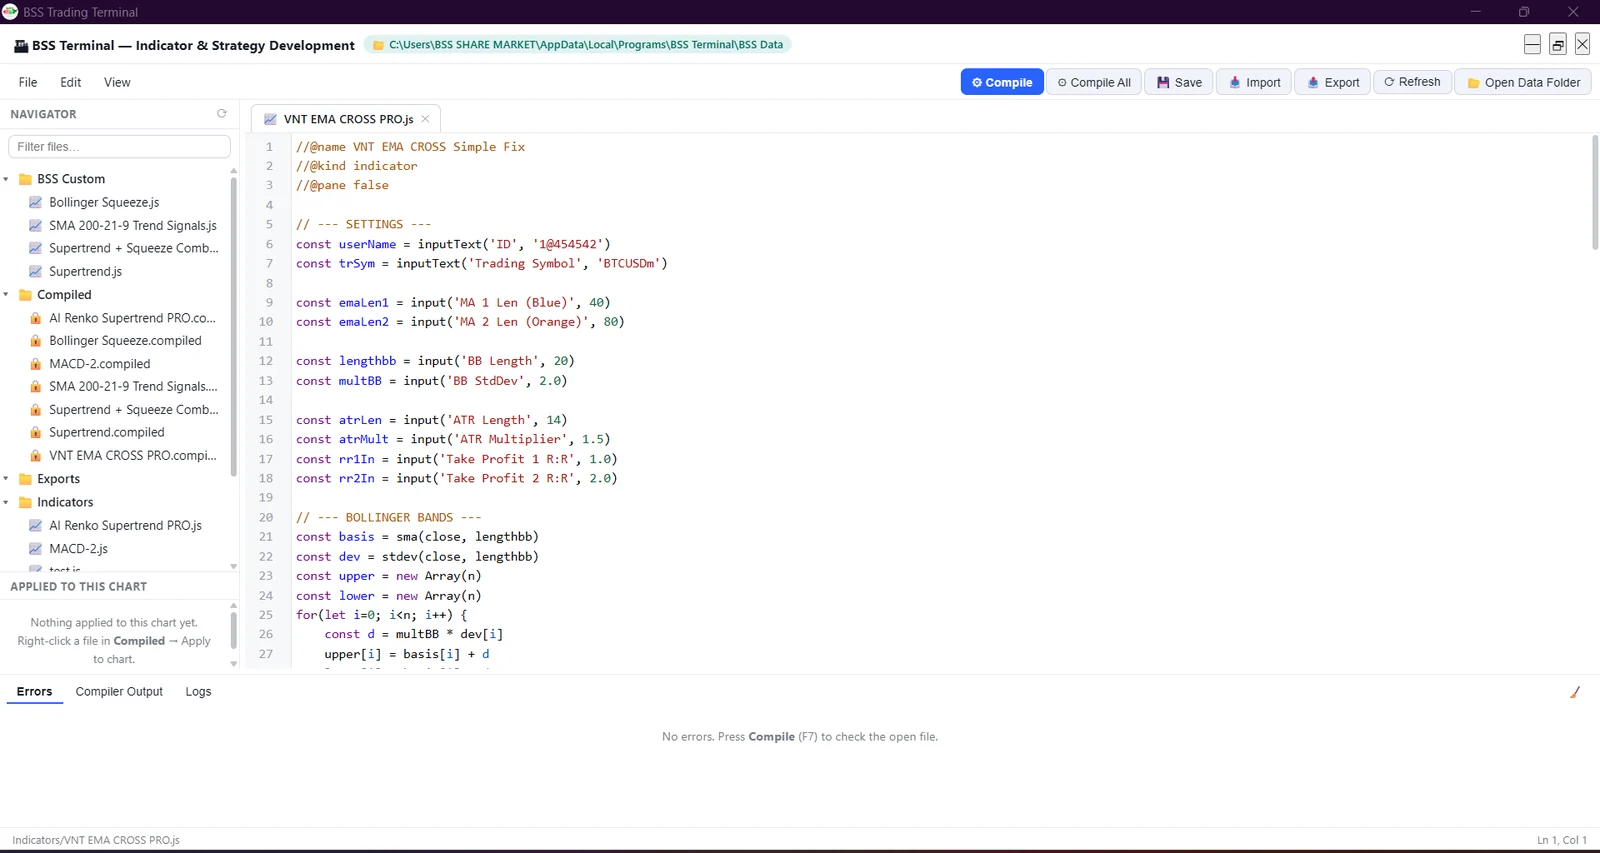
The editor with the file navigator, compiler and error list

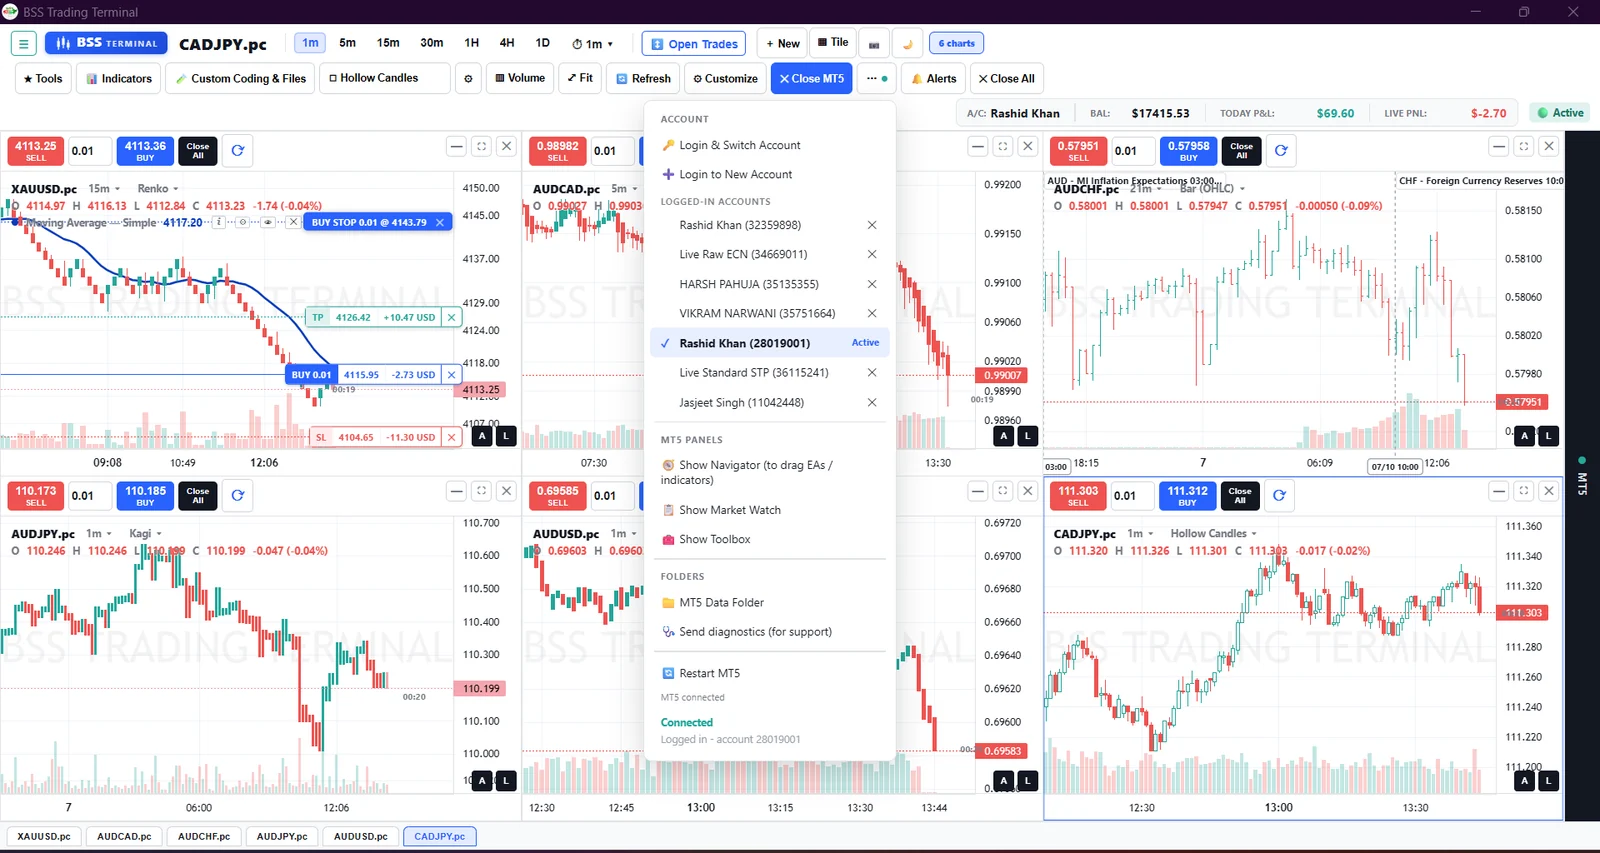
MT5 running inside the terminal, connected and reporting it in the log

The built-in indicator library with search

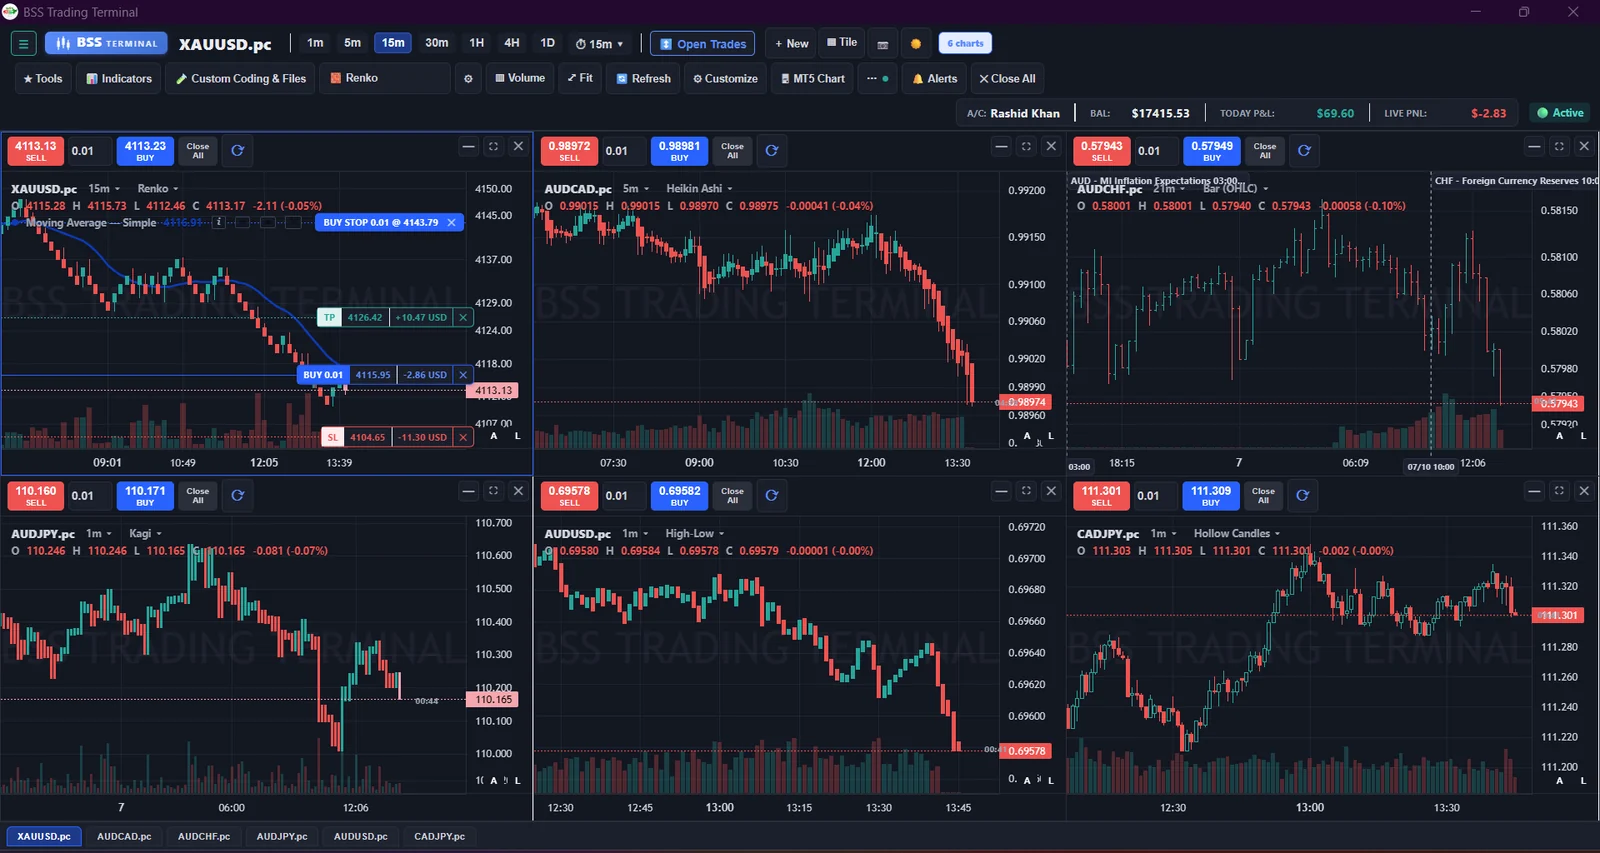
The six-chart grid in the dark theme

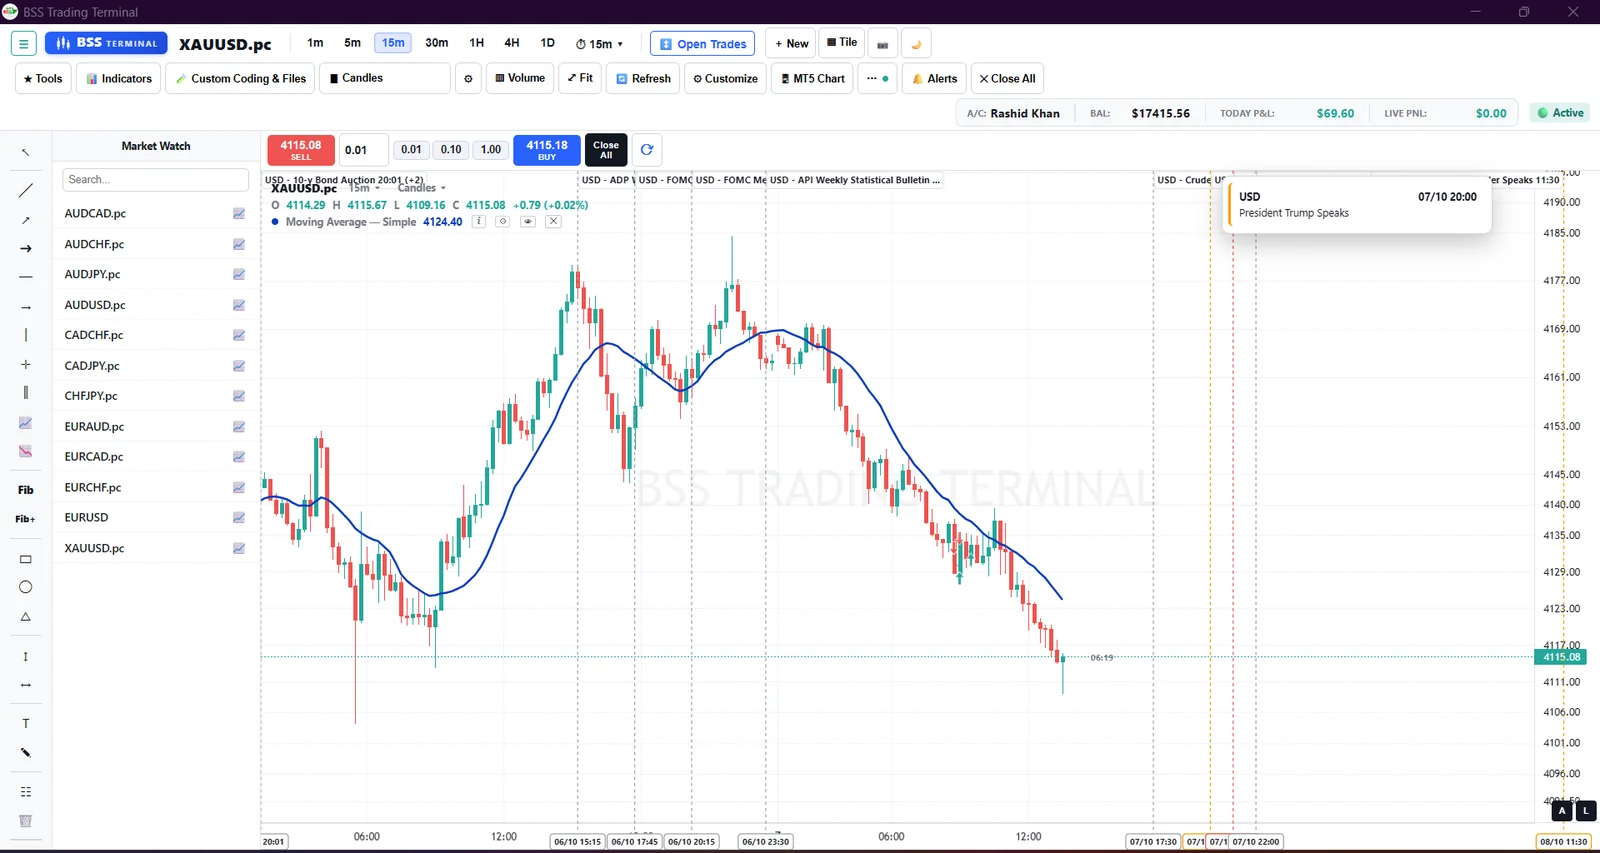
Economic events on the chart, with a tooltip for the one under the pointer

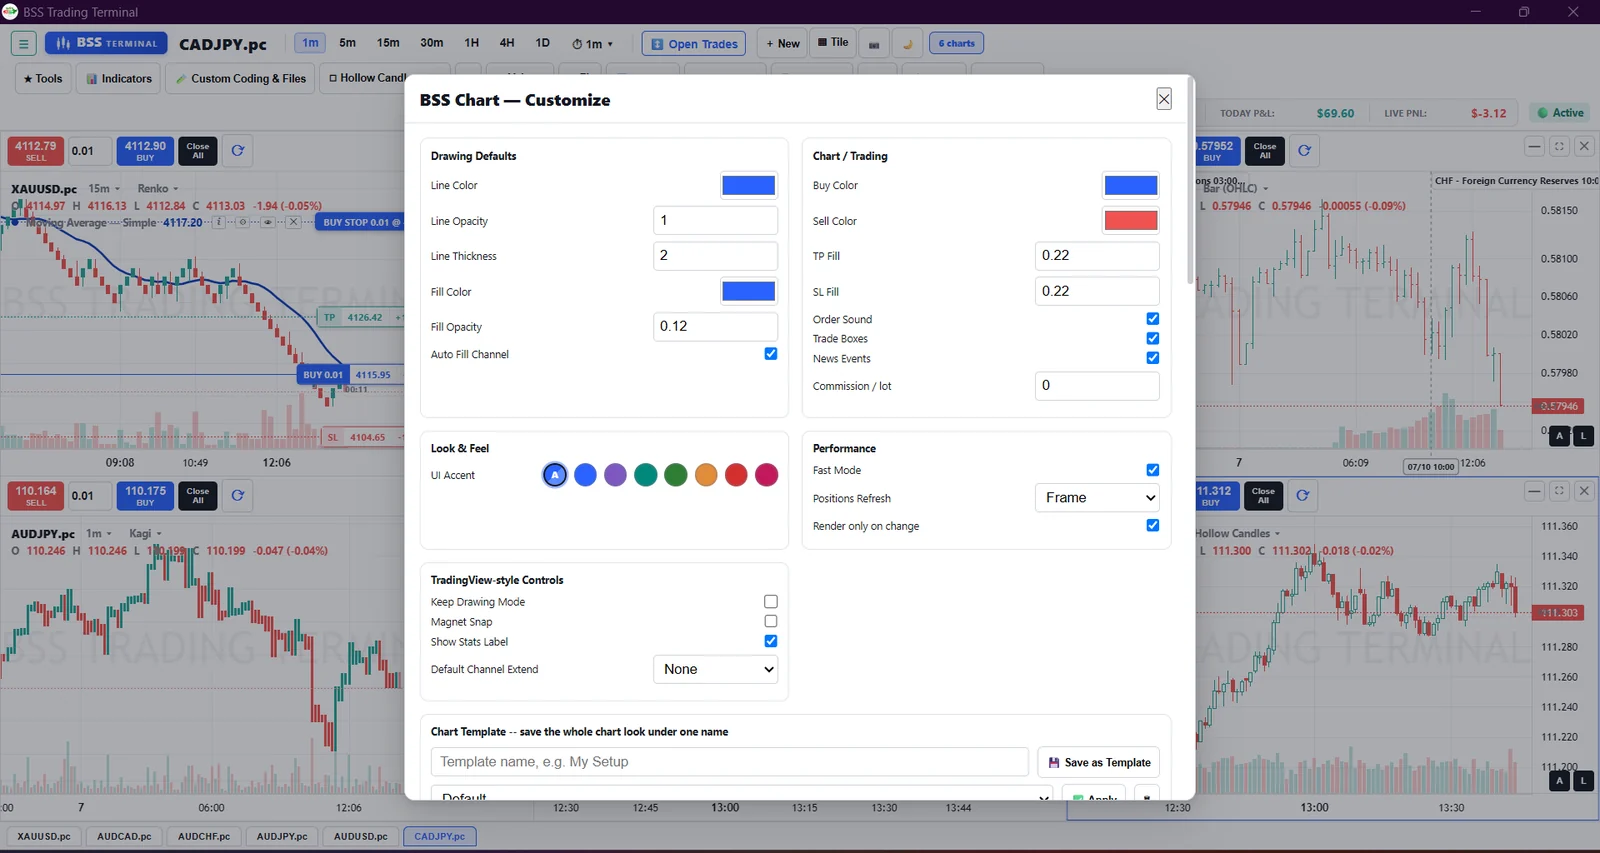
The Customize window: colours, sounds, performance and interface accent

Inside the terminal, feature by feature

Every screenshot below comes from the terminal itself. Each one slides on its own, and opens full screen when you click or tap it.

01

Sixteen chart types, one workspace

Candles, Hollow Candles, Bar (OHLC), High-Low, Heikin Ashi, Renko, Range Bars, Three Line Break, Kagi, Point & Figure, Line, Line with Markers, Step Line, Area, Baseline and Columns.
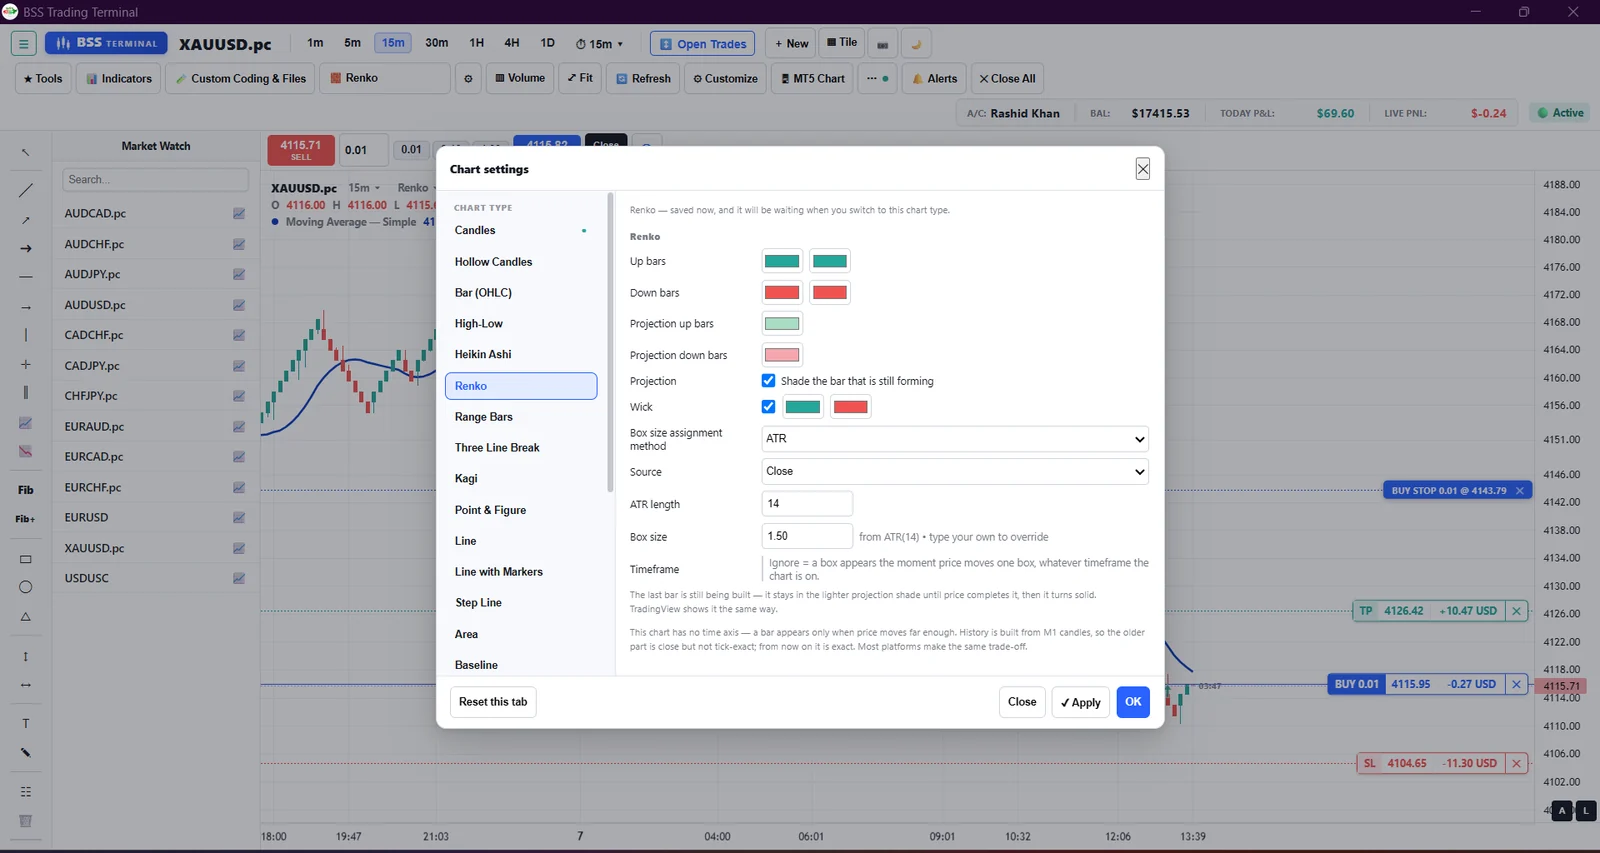
The full chart type list, with Renko box size, colours and projection settings

The full chart type list, with Renko box size, colours and projection settings

A Renko chart. The terminal explains why news lines are hidden on price-based charts

Heikin Ashi candles on gold, with a moving average on the chart

Range Bars, with box size taken from ATR(14) or typed by hand

Kagi, with the reversal amount and a plain explanation of yang and yin

A single full-width chart with volume below the price

What it does

Each chart type keeps its own colours and settings, so switching between them never loses your setup. Renko, Range Bars and Kagi size their bricks from ATR automatically, or you type your own box size. The bar that is still forming shows in a lighter shade until price completes it.

What it gives you

Read the same market in more than one way without leaving the terminal or opening a second platform.

How you use it

Open the chart type button in the toolbar, pick a type, and set its colours and box size in the panel beside the list.
02

Up to six charts on one screen

Every chart in the grid keeps its own symbol, its own timeframe, its own chart type and its own buy and sell panel.

Six charts, each on a different symbol, timeframe and chart type

Six charts, each on a different symbol, timeframe and chart type

The same grid with a one-click Close All on every chart

The six-chart grid in the dark theme

Dark theme carries through every panel and price scale

What it does

Tile six markets side by side, or maximise one and come back to the grid with a click. Symbol tabs sit along the bottom. Light and dark both carry the whole layout.

What it gives you

Watch gold, the majors and your own pairs together, and place an order on any of them without switching windows.

How you use it

Press Tile for the grid, or the chart count button to choose how many charts you want. Each chart's own header sets its symbol and timeframe.

03

Trade from the chart, and keep the record

One-click buy and sell with your own lot buttons, pending orders, and entry, target and stop drawn on the chart with live profit and loss on each line.

Pending order, entry, take profit and stop loss, each with live profit and loss

Pending order, entry, take profit and stop loss, each with live profit and loss

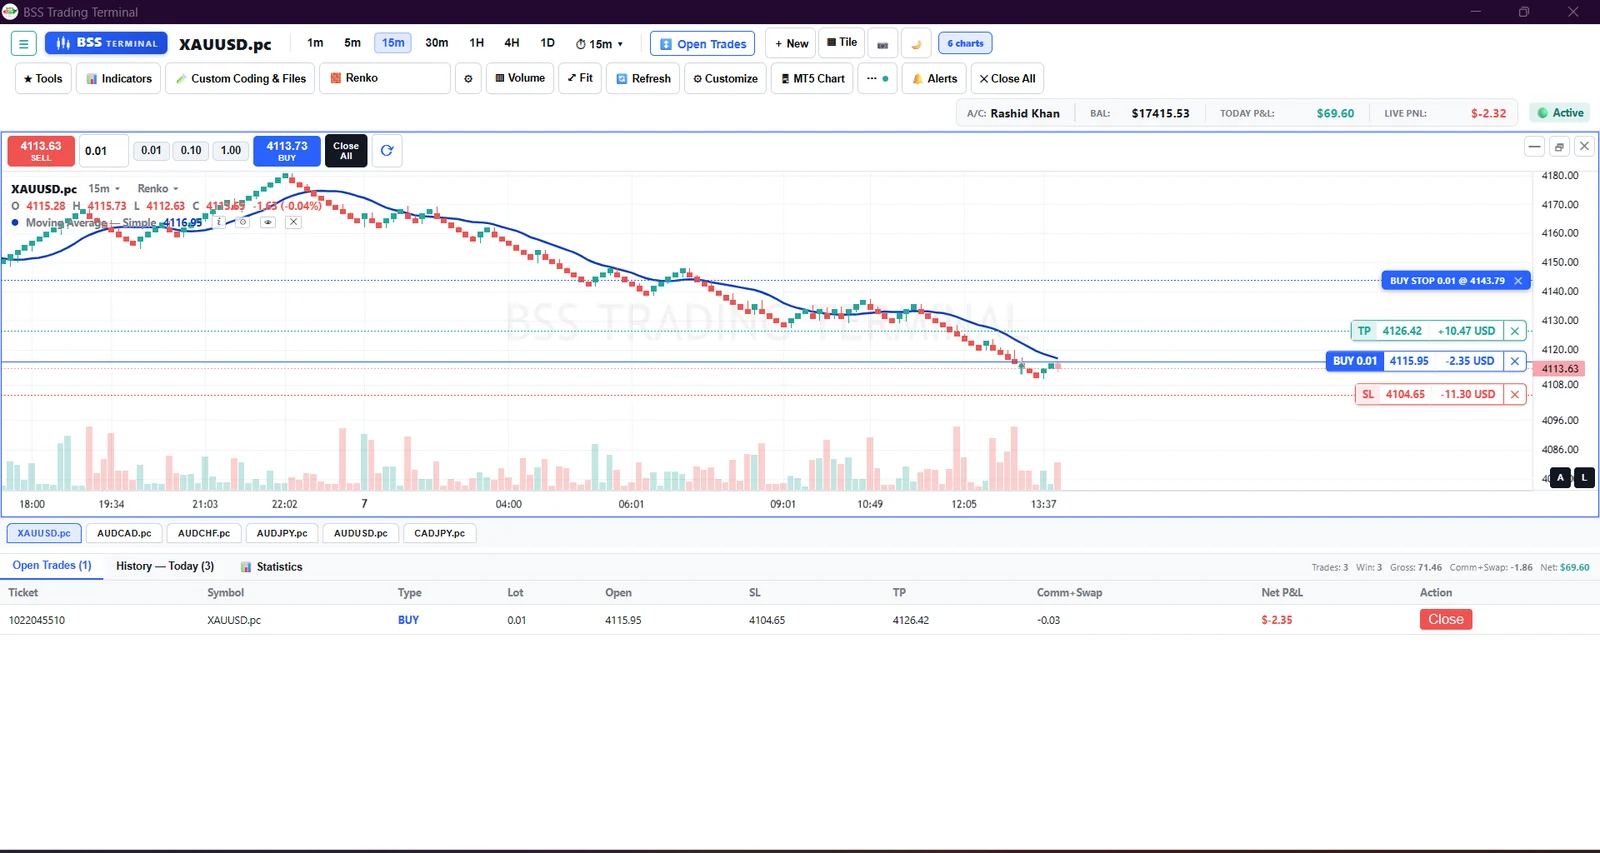
Open Trades: ticket, lot, open price, SL, TP, costs and a close button

Today's closed trades with both sides of each trade, exportable to PDF or Excel

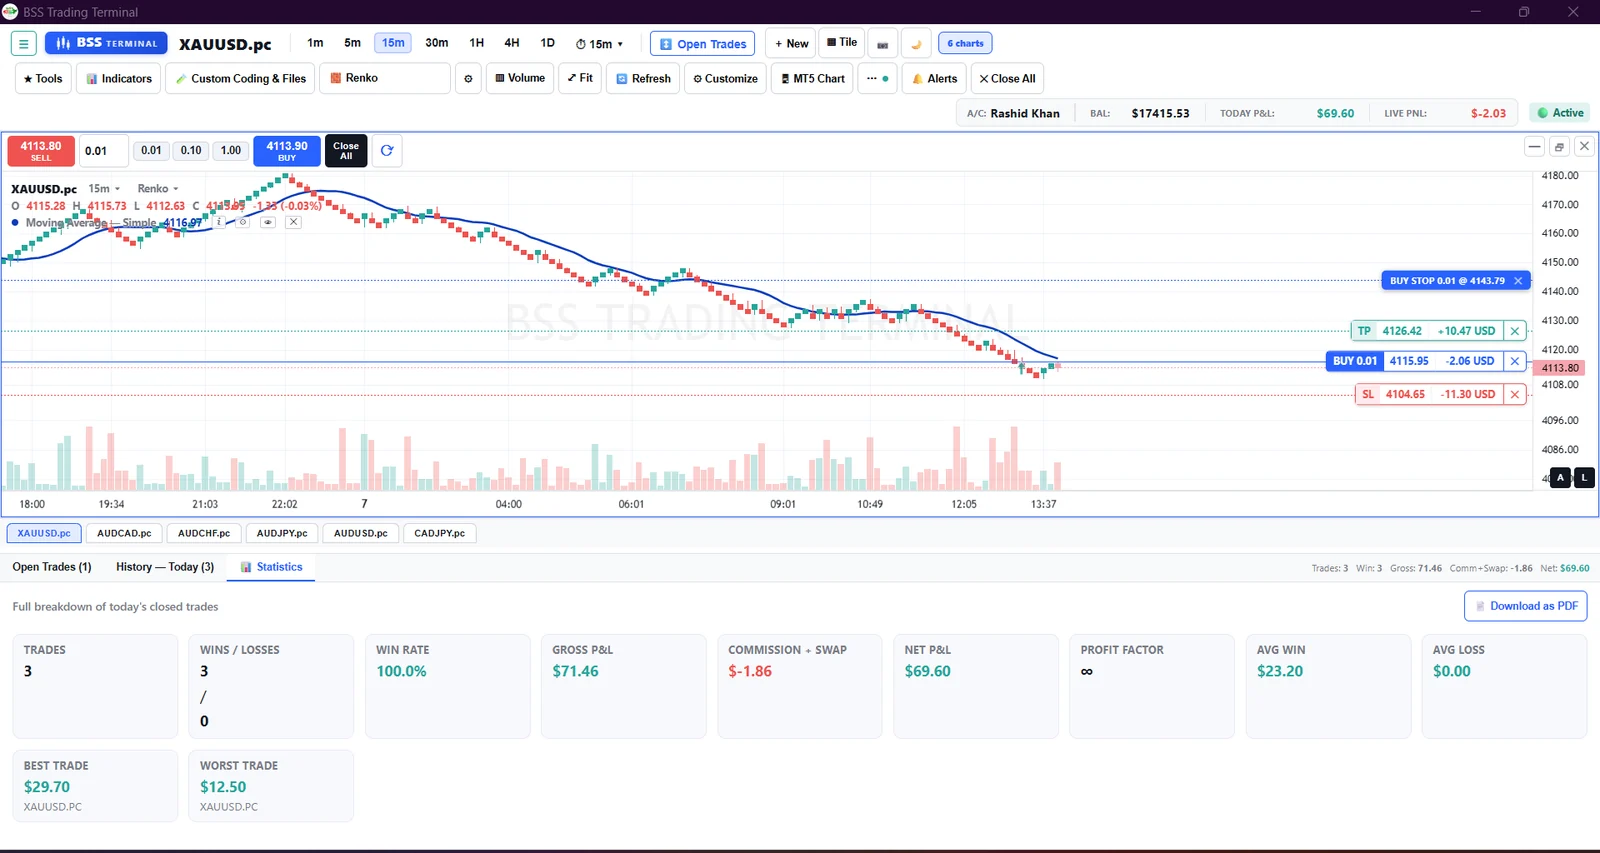
The statistics panel. The figures shown are one day on one account, included to show the panel itself. They are not a performance claim and not a promise of any result.

What it does

Close a position or cancel a pending order from the line itself. Below the chart, Open Trades lists ticket, lot, open price, SL, TP, commission and swap. History shows every trade closed today with both sides of the trade, and exports to PDF or Excel. Statistics adds up the day.

What it gives you

Place the order, manage it and record it in one place, with your costs already subtracted from the figures you see.

How you use it

Use the buy and sell panel above the chart, drag the TP and SL lines to move them, and open the panel at the bottom for trades, history and statistics.

04

Drawing tools that stay where you put them

Trend lines, rays, channels, rectangles, ellipses, triangles, Fibonacci retracement and extension, long and short position tools, text and brush.

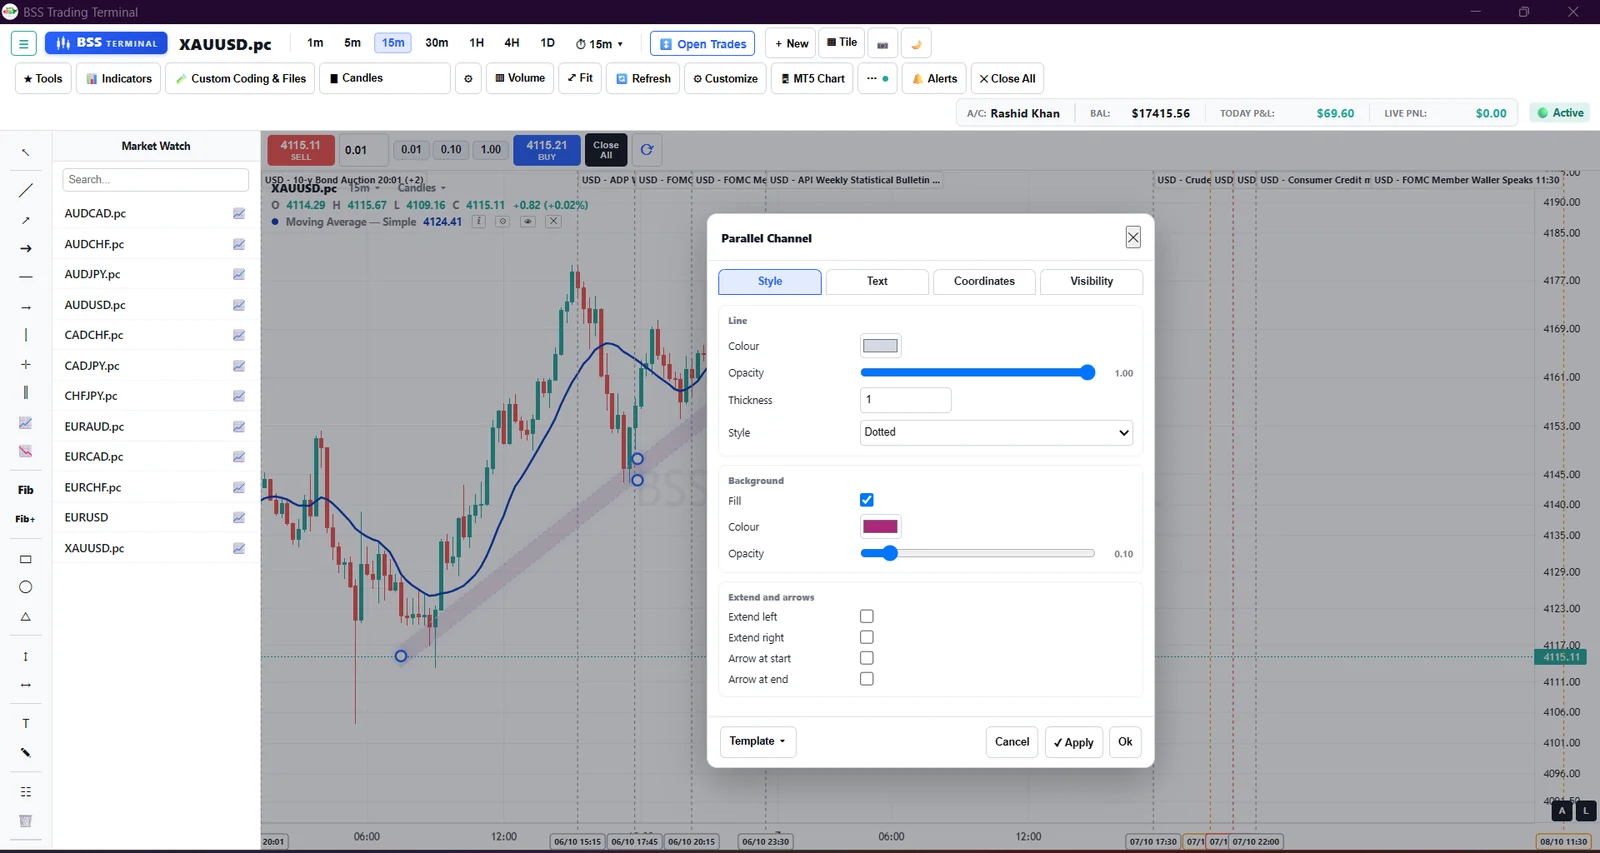
A parallel channel with its floating style bar

A parallel channel with its floating style bar

Full settings for a drawing: line, fill, extend, arrows and templates

Right-click: clone, lock, hide, copy and paste style, order and delete

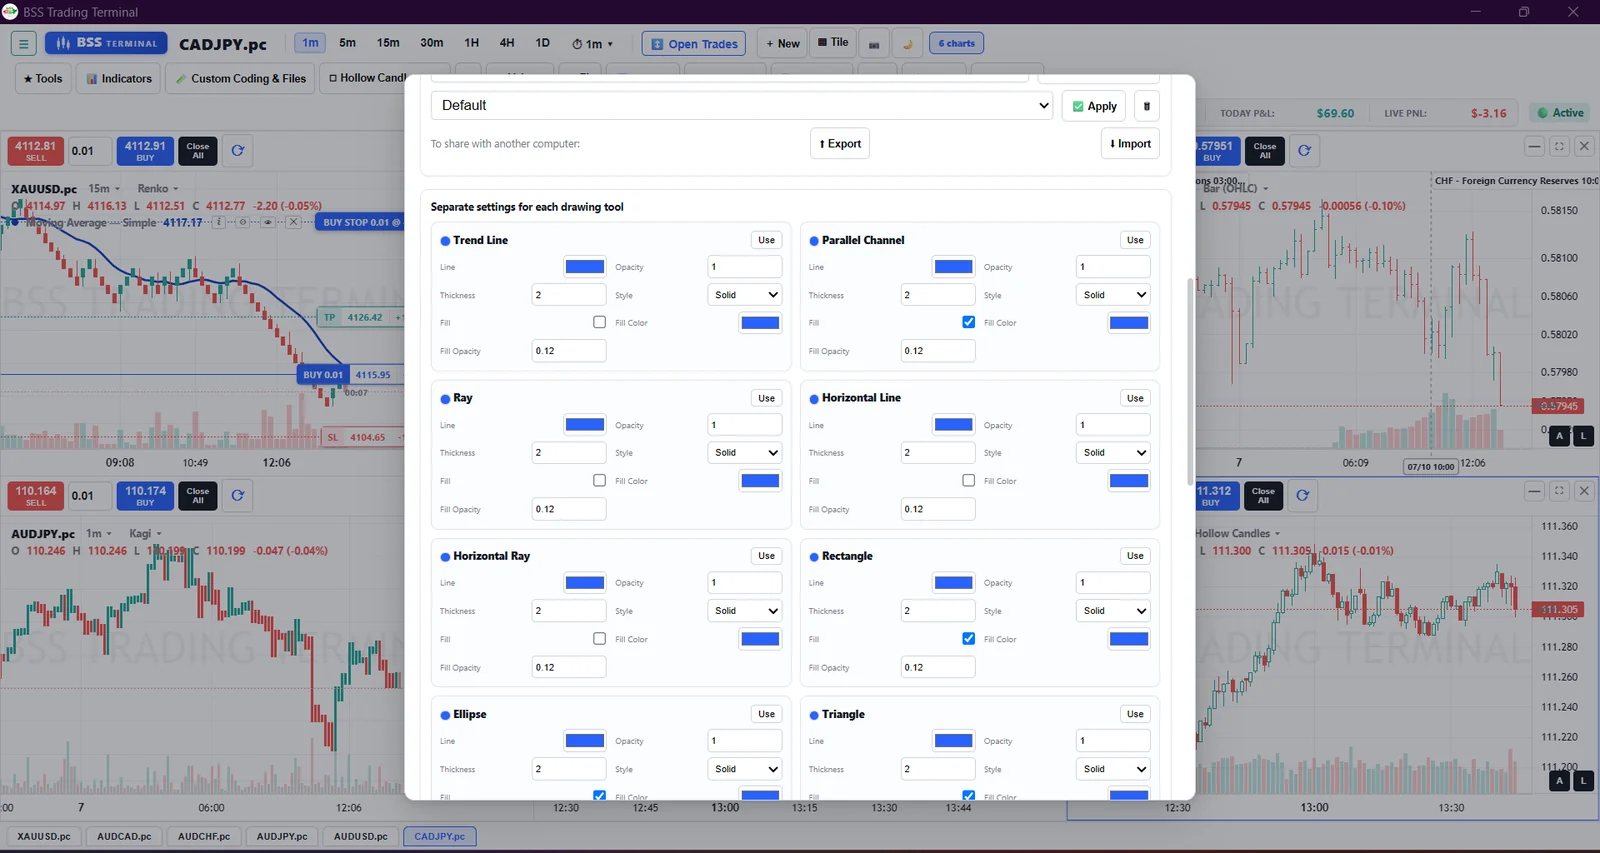
A separate default look saved for every drawing tool

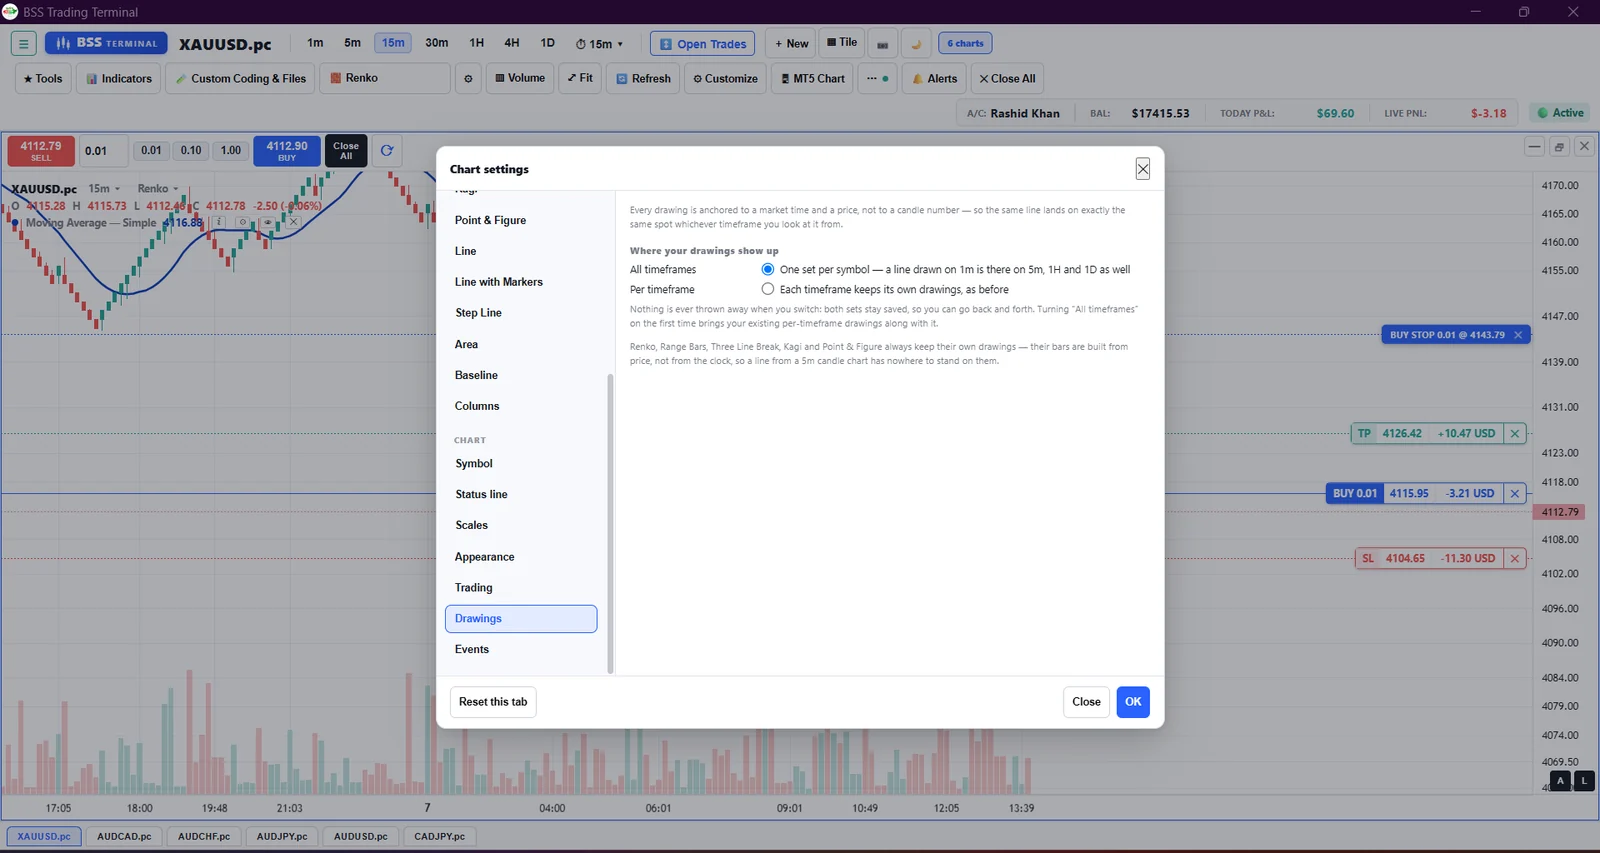
One set of drawings per symbol across all timeframes, or one set per timeframe

What it does

Every drawing is anchored to a market time and a price, not to a candle number. A line drawn on the 1-minute chart sits in exactly the same place on 5m, 1H and 1D, or you can keep a separate set per timeframe. Select a drawing for a floating bar of colour, thickness, style, lock, hide, clone and delete, or open the full settings dialog. Right-click gives copy style and paste style.

What it gives you

Mark a level once and find it on every timeframe, with the look you chose rather than a default you have to fix each time.

How you use it

Pick a tool from the left rail and draw. Set the default look of each tool once in Customize, and it applies to everything you draw after that.

05

A full indicator library, and room for your own

Moving averages of every kind, Bollinger Bands, Envelopes, Parabolic SAR, RSI, ADX and the rest, all searchable.

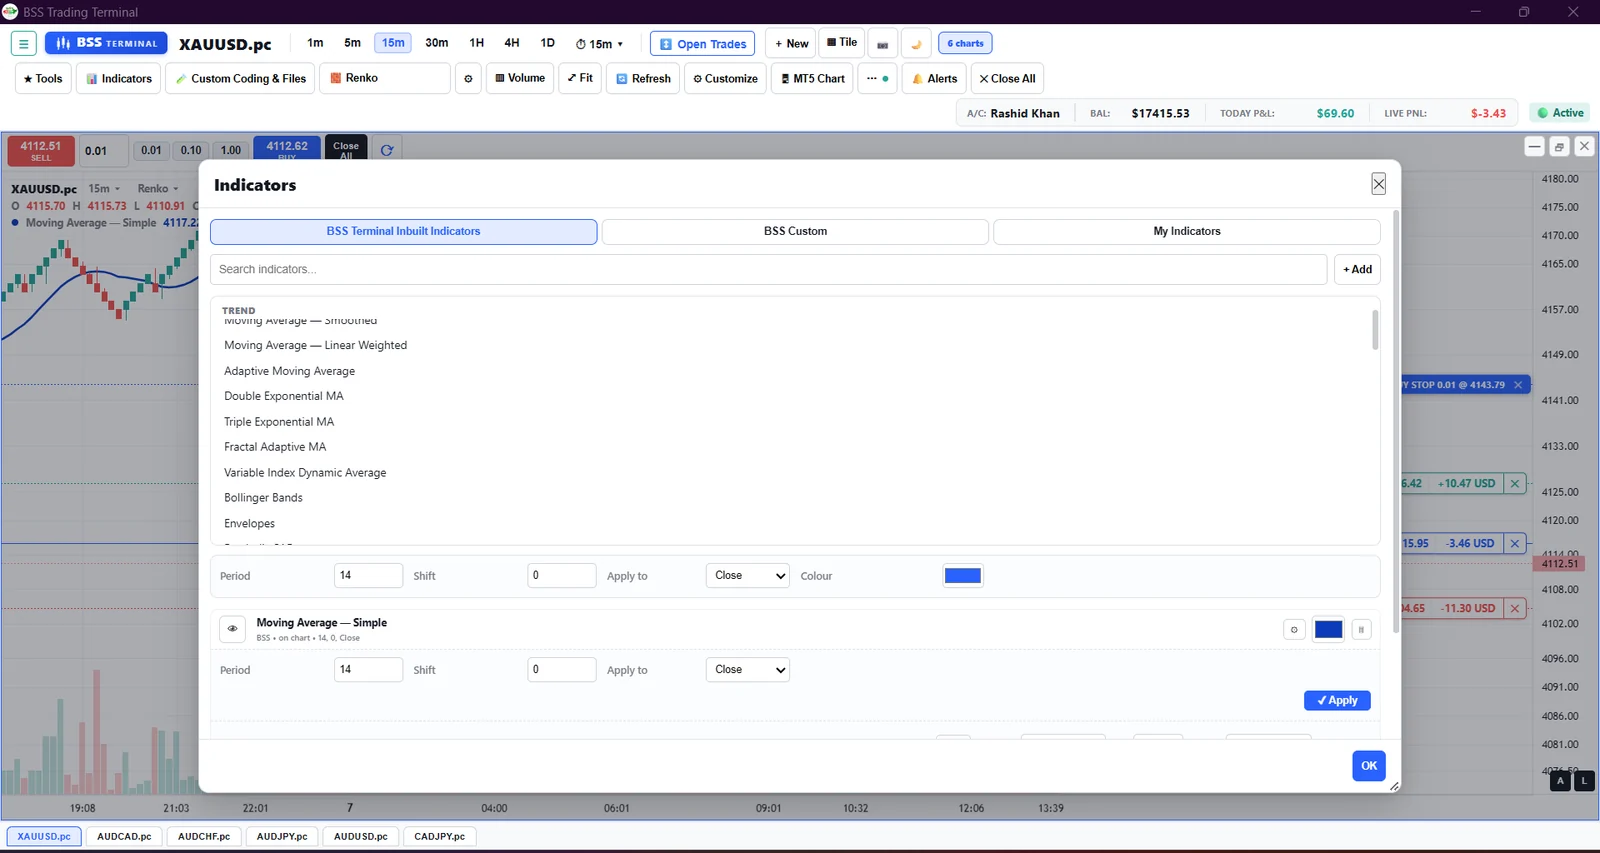
The built-in indicator library with search

The built-in indicator library with search

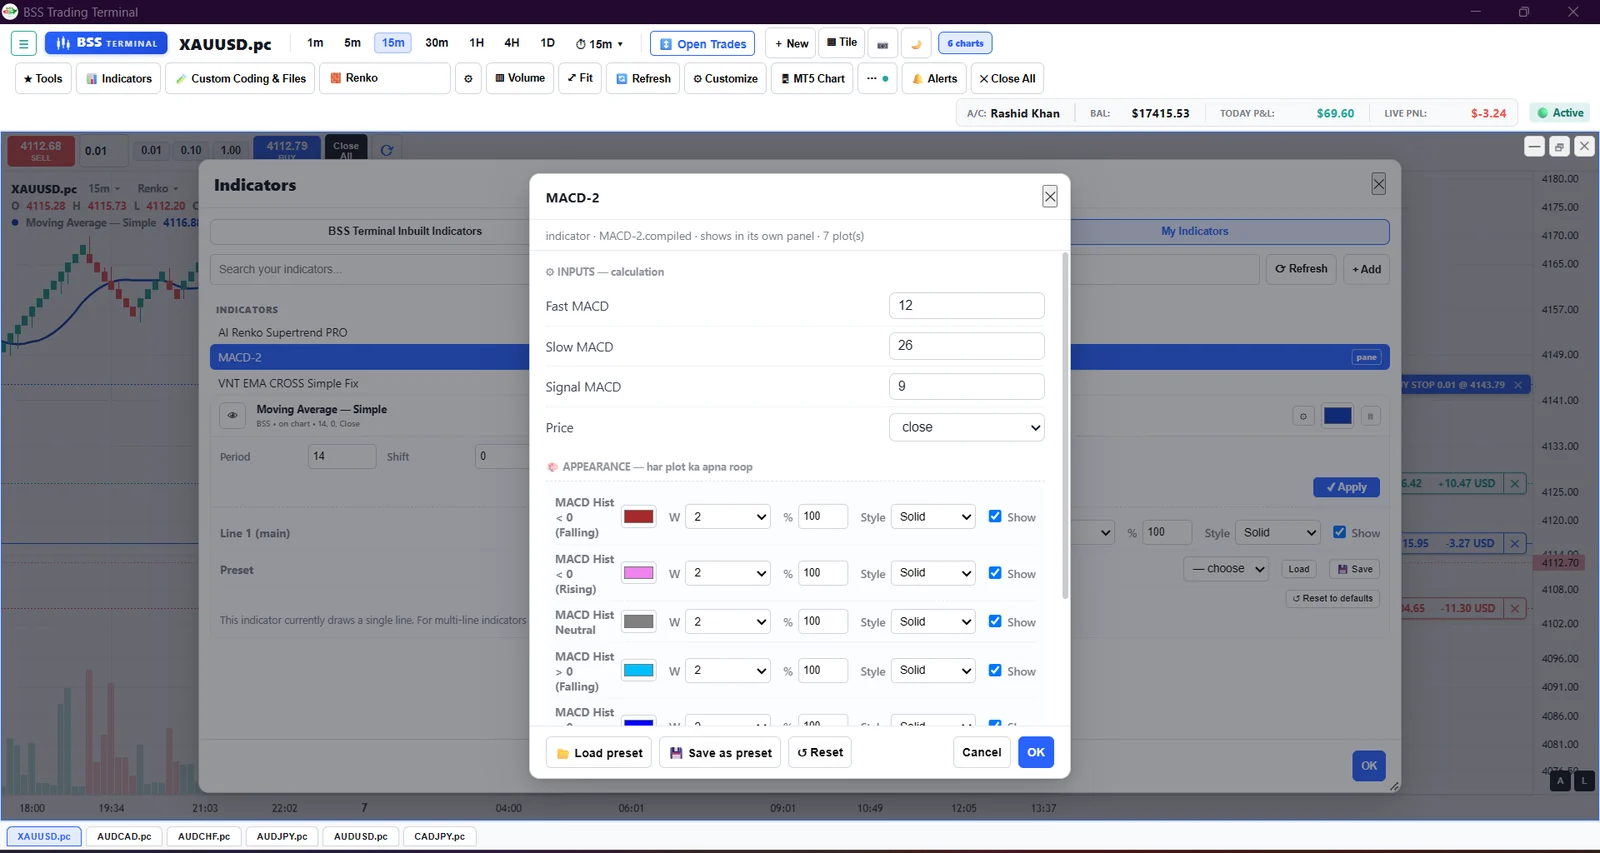
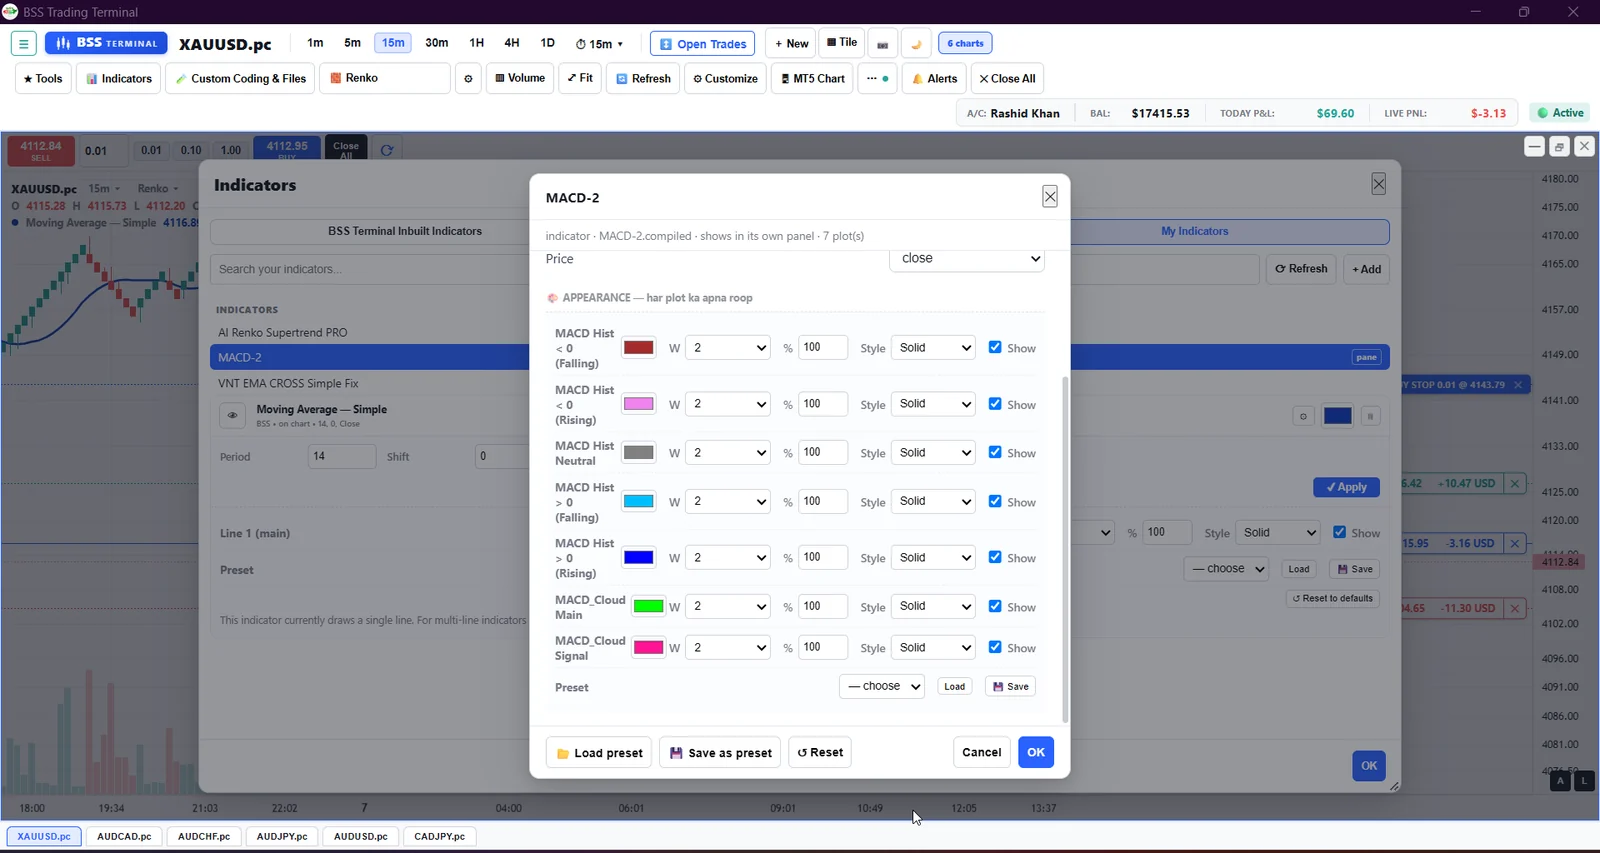
A custom MACD with its own inputs, shown in its own panel

Every plot inside an indicator styled separately, and saved as a preset

What it does

Built-in indicators take period, shift, source and colour. Your own indicators sit in their own tabs, and every plot inside them gets its own colour, width, opacity, line style and show or hide switch. Save your settings as a preset and load it on any chart.

What it gives you

Set an indicator up the way you read it once, then bring that exact look back whenever you need it.

How you use it

Open Indicators, search, press Add, and adjust it in the panel below. Save as preset when you are happy with it.

06

Write your own indicators and strategies

A complete development window inside the terminal: editor, compiler, error list and your own folders.

The editor with the file navigator, compiler and error list

The editor with the file navigator, compiler and error list

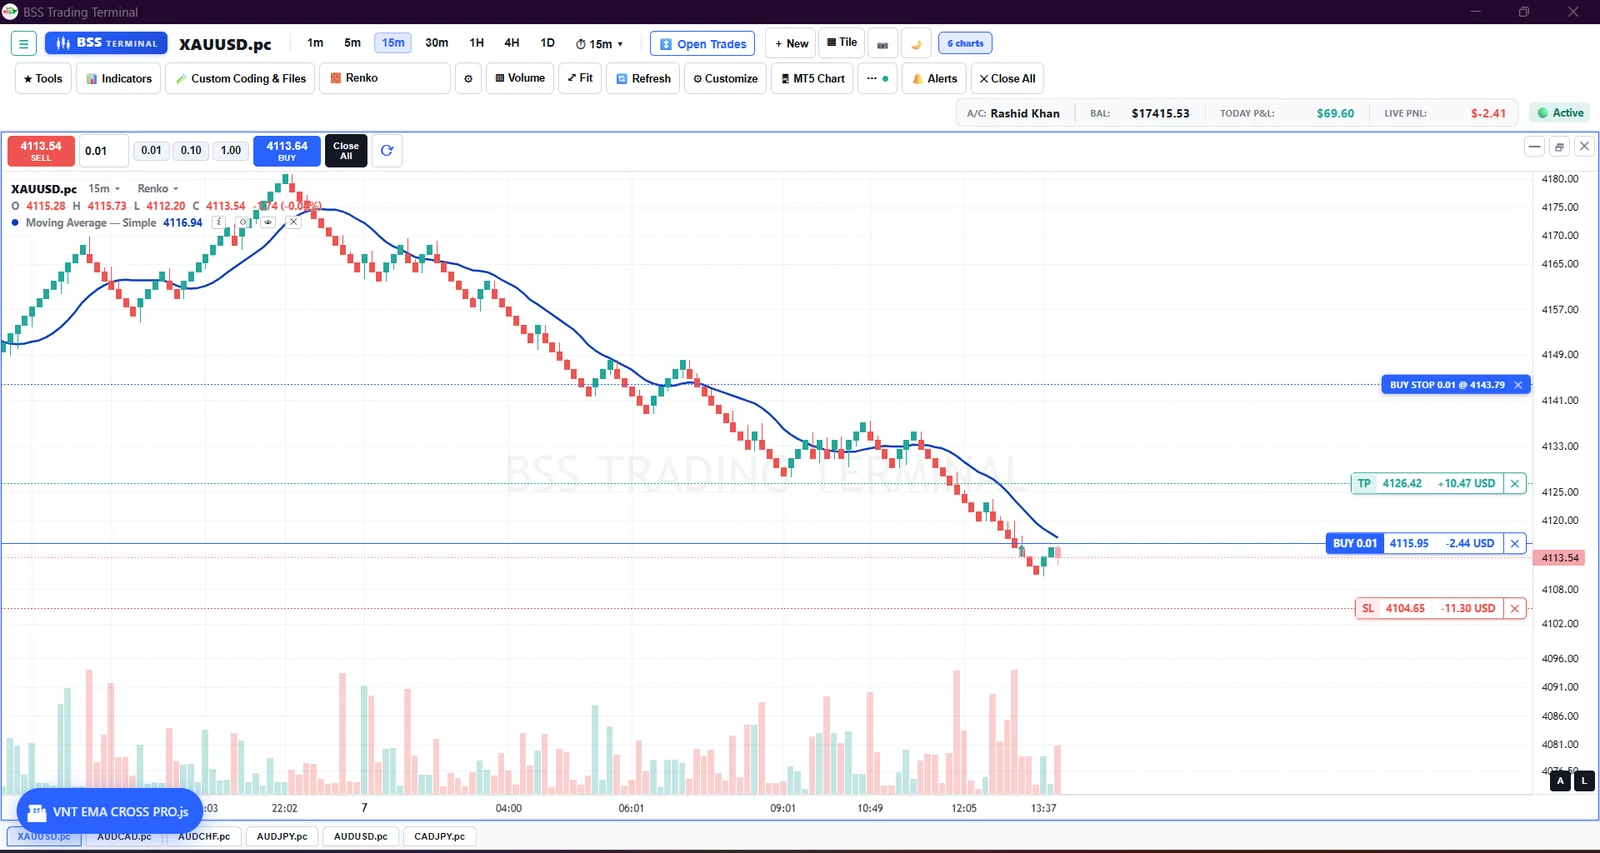
A freshly compiled indicator going straight onto the chart

New indicator, strategy, script or library, with source and compiled export

Find and replace, format code and word wrap

Layout controls, script run timeout and the scripting reference

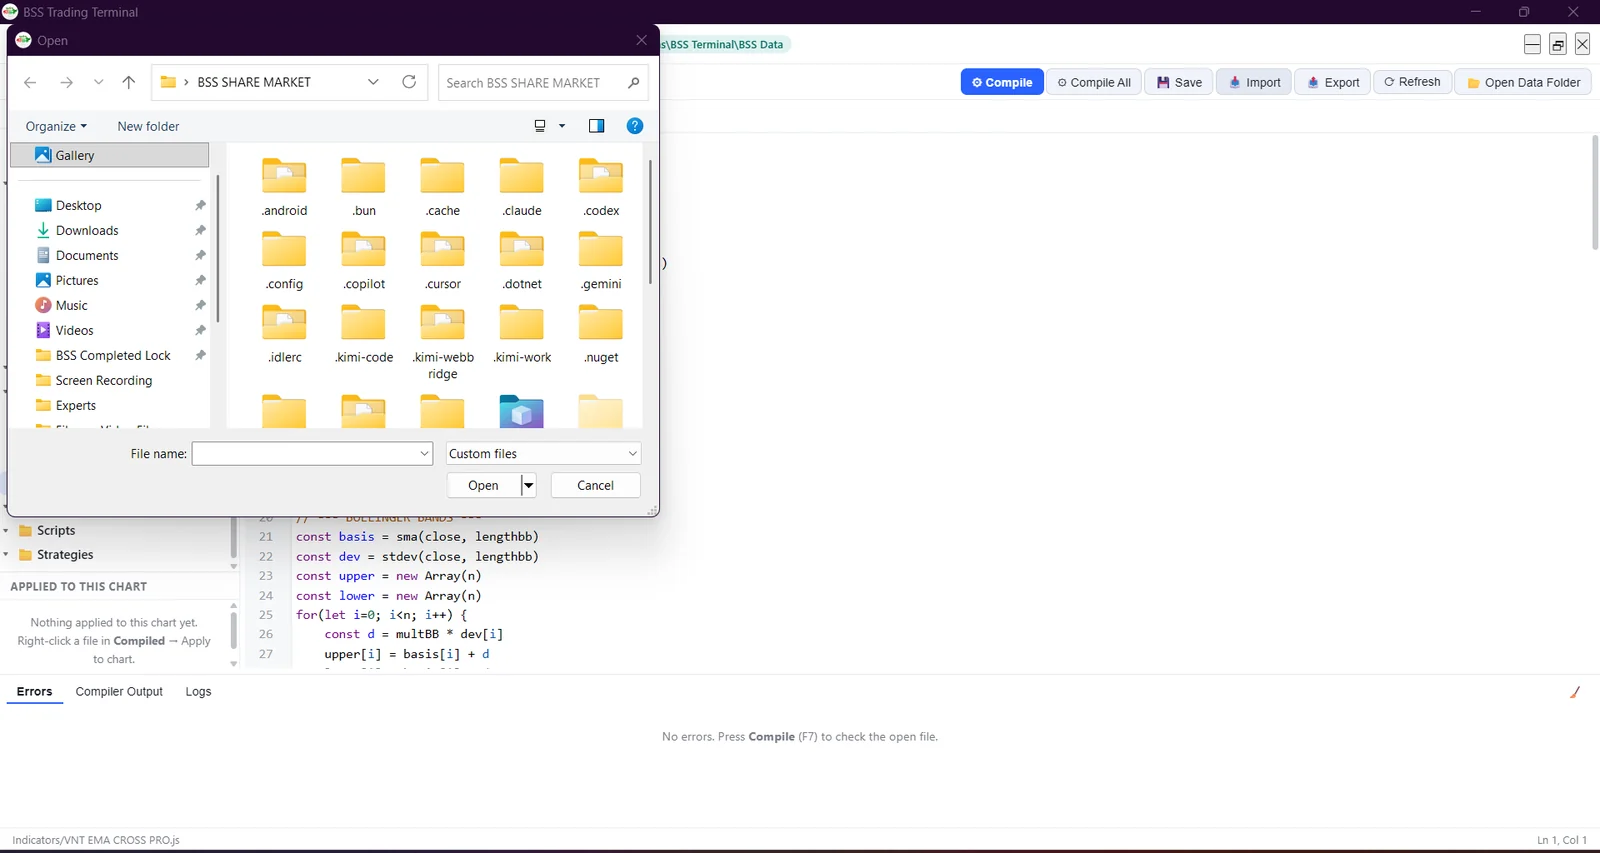
Importing a file written somewhere else

What it does

New Indicator, New Strategy, New Script and New Library File. Write in JavaScript, press Compile, and the errors or the compiled file appear straight away. Find and replace, format code, word wrap and a scripting reference are all there. Compiled files can be exported on their own, so an indicator can be shared without giving away its source.

What it gives you

Build the tool you actually want instead of settling for the closest one on the list, and put it on a chart the moment it compiles.

How you use it

Open Custom Coding & Files, create a file, write it, press Compile, then right-click the compiled file and apply it to the chart.

07

MetaTrader 5 inside the terminal

The MT5 window, its Market Watch, Navigator and Toolbox, all in the same application.

MT5 running inside the terminal, connected and reporting it in the log

MT5 running inside the terminal, connected and reporting it in the log

Several accounts logged in at once, with one-click switching

What it does

Drag an expert advisor or an MT5 indicator straight from the Navigator onto a chart. Several accounts stay logged in at once and you switch between them with one click. There is a shortcut to the MT5 data folder, a restart button and a diagnostics button for support.

What it gives you

Keep the MT5 tools you already rely on without alt-tabbing between two platforms.

How you use it

Press MT5 Chart to open the panel, and use the account menu to log in, switch accounts or show the MT5 panels you need.

08

Price alerts and the economic calendar

Set an alert on any level, and see the day's events on the chart itself.

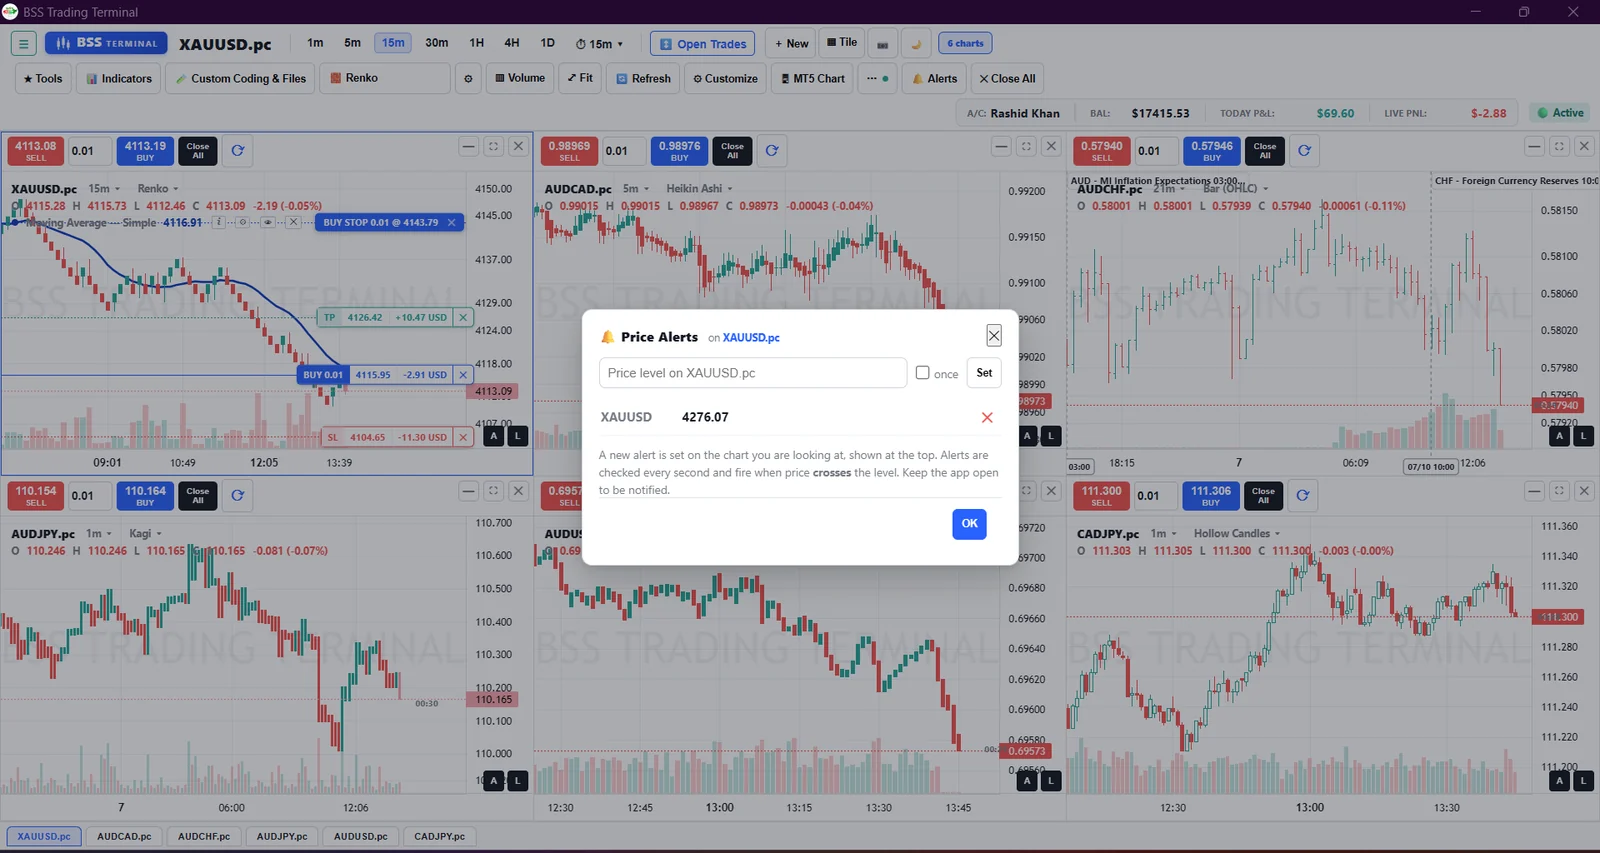
Setting a price alert, with the existing alerts listed below

Setting a price alert, with the existing alerts listed below

Economic events on the chart, with a tooltip for the one under the pointer

High, medium and low impact events switched on or off separately

What it does

Alerts are checked every second and fire the moment price crosses your level, once or every time. Calendar events come from MT5 and stand as vertical lines on the chart, with the event name above and a tooltip on hover. High, medium and low impact events can each be turned on or off.

What it gives you

Stop watching the screen for a level, and know what is about to be released before you place an order.

How you use it

Press Alerts, type the price and press Set. Turn the news lines on or off under Settings, then Events.

09

Make it look the way you want

Almost everything on the chart can be set, saved under a name, and carried to another computer.

The Customize window: colours, sounds, performance and interface accent

The Customize window: colours, sounds, performance and interface accent

Templates saved by name, and exported to another computer

Order colours, the entry-target-stop box, past trade marks and commission

Background, grid, crosshair and the watermark behind the candles

Price scale, margins, bar spacing and the time axis

Exactly what the line above the chart tells you

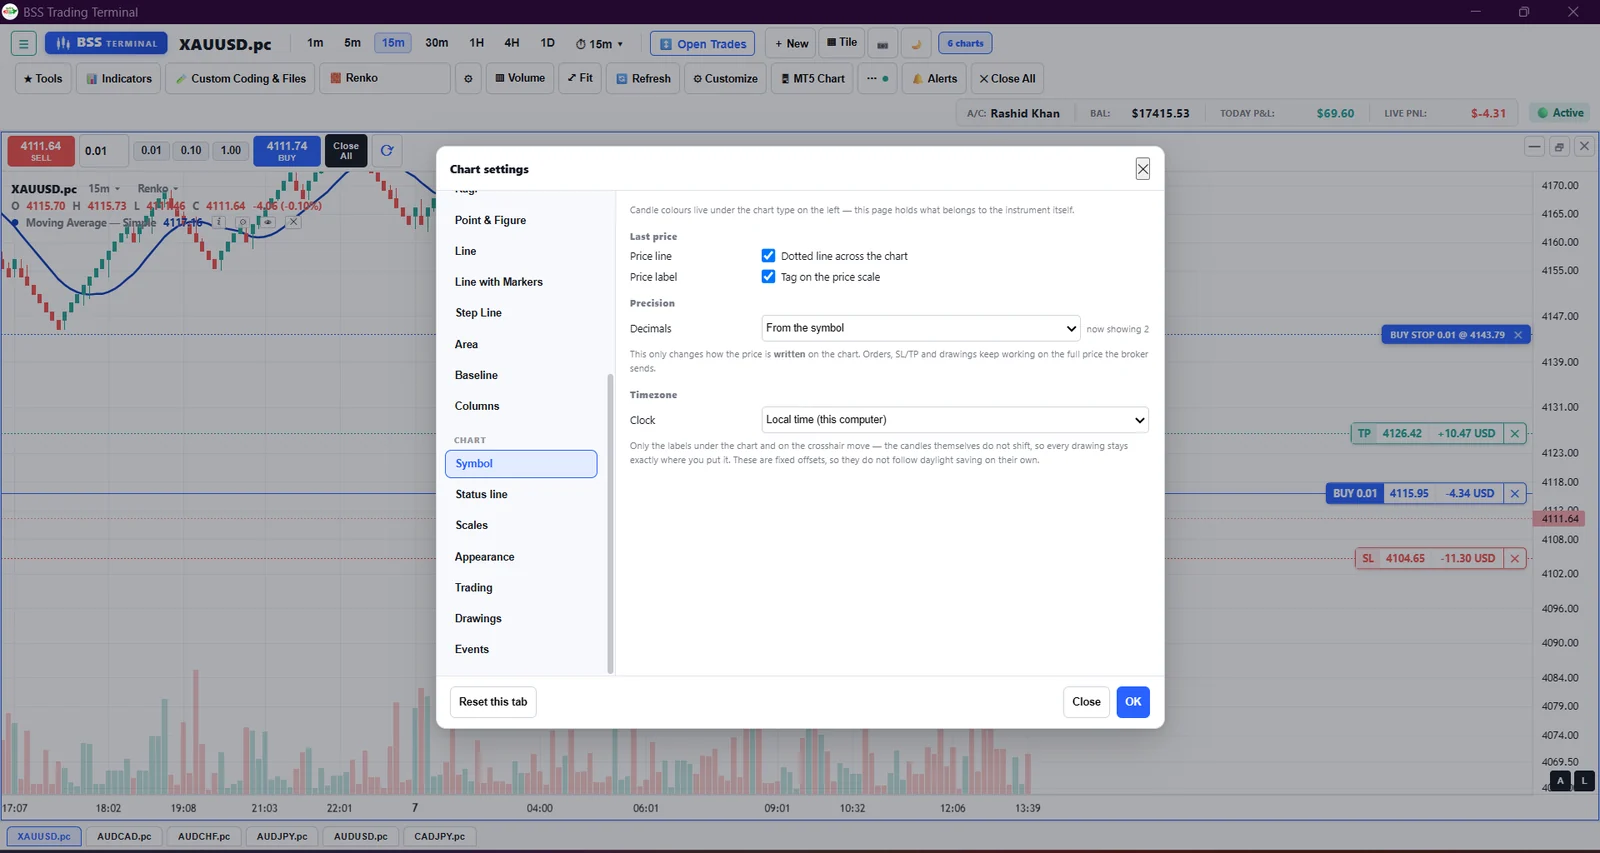
Last price line, decimals and the clock the chart runs on

What it does

Buy and sell colours, target and stop fills, commission per lot, order and tap sounds, grid lines, crosshair, watermark text, price scale and margins, the status line above the chart, decimals, clock timezone, and the accent colour of the interface. Save the whole look as a template, then export it and import it on another machine. Any colour left on Theme follows day and night on its own.

What it gives you

One setup, saved once, that follows you to every chart and every computer you trade on.

How you use it

Press Customize for the whole-terminal settings, or the gear beside the chart type for this chart's own tabs. Save as Template when it looks right.

Features

Charts

  • Several charts and timeframes at once
  • Custom minute timeframes
  • Candlestick, Heikin Ashi, Renko, Kagi, Range bar, Three line break and Point and figure
  • Volume and economic news markers

Indicators

  • A built-in library including moving averages, RSI, ADX, Bollinger Bands and Envelopes
  • BSS custom indicators such as Bollinger Squeeze (TTM) and Supertrend
  • Write your own indicators in JavaScript in the built-in code window
  • A personal list for the indicators you add

Drawing tools

  • Trend, ray, horizontal, vertical and cross lines
  • Parallel channels, Fibonacci tools and a risk and reward tool
  • Rectangles, ellipses, triangles and text
  • Editable colors, line styles and labels

Trading and tools

  • Open trades, one-click lot sizes and Close all
  • Today's trade history, exportable to PDF and Excel
  • A market watch with search
  • Open a MetaTrader 5 chart beside the terminal, with price alerts and a dark theme

How to get it and install it

  1. Open a free trading account through one of our referral links (Open an Account page). This is what makes the terminal free for life.
  2. Download the terminal installer from our Download page.
  3. Download and install UltraViewer, a free remote-desktop app like AnyDesk.
  4. Send us your UltraViewer ID and password on WhatsApp, with your trading account number and broker name.
  5. Our team connects, installs the terminal and activates your licence while you watch.
  6. No referral account? You can still use the terminal for ₹500 per month.

Requirements

Access terms

Placeholder wording: the final terms need legal review before launch.

Questions

How do I get access?

Pay ₹500 per month, or open a trading account through our referral link for lifetime access. See How it works and the access terms on this page.

Is there a demo?

Demo details will be added to this page. Contact us if you would like to try the terminal first.

Does the terminal give investment advice?

No. It is a software tool for charting and placing trades you decide on yourself.

Where do I download it after buying?

Log in and open My products. Your download, license key and release notes will be there.

Trading in financial markets involves risk, including loss of capital. Placeholder wording: final text needs legal review before launch.
WhatsApp